The recent correction in the equity market three weeks ago has been fully reverted with in particular US indices having created new all- time- highs again. The positive momentum has geared up steam as well due to the falling inflation report from last week. Falling consumer prices help the Federal Reserve to cut rates during this week’s meeting. Cheaper liquidity helps stock markets and in particular the rise of the Nasdaq technology index might boost the demand of cryptocurrencies.
Potential strength of the Dollar currently weighs negatively on markets. Should the Greenback continue to move upwards, Bitcoin among other tokens might face a tough time for rising prices.
Technical Analysis
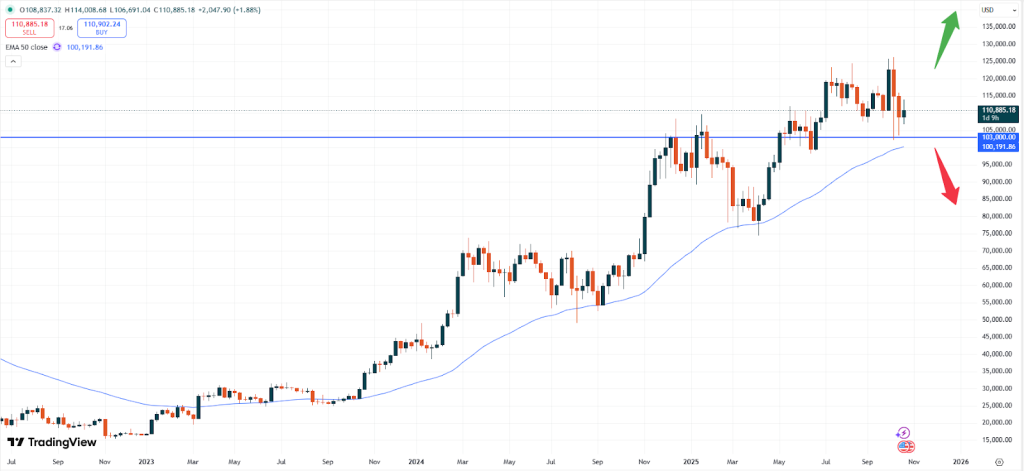
BTC – Bitcoin is trading at USD 110,885. The price development shows that the market has been falling behind and seems to be on track to rather test the psychological level of USD 110,000. The weekly chart below shows, that at this level also the 50- moving average would help to support the price.
BTCUSD weekly chart
If the market can start to break the next technical price level of USD 115,000 more upside momentum might be seen. At least a break of the most recent candlestick high should be seen to create more buying pressure. Until then traders might be better off waiting for some further clarity in the market.
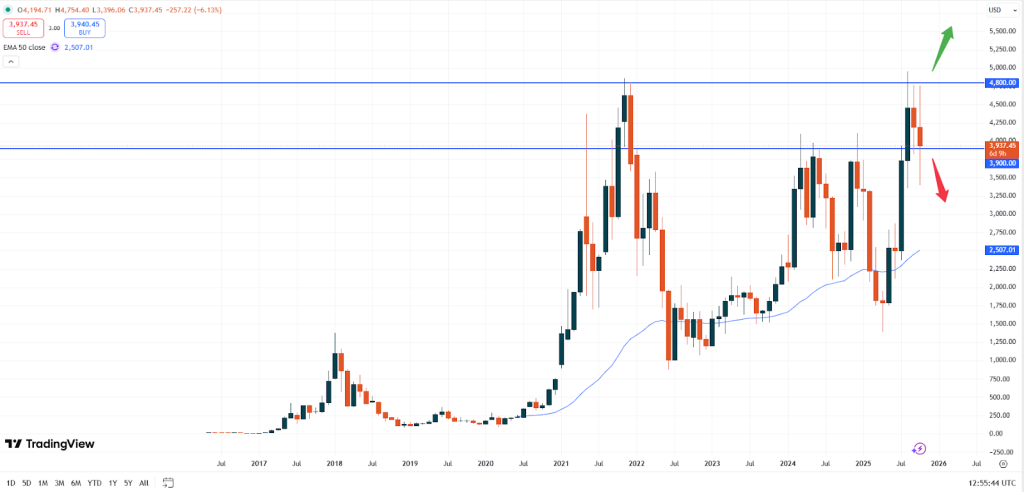
ETH – Ethereum is currently trading at USD 4,937. The price has been following the path of Bitcoin and looks set to weaken further currently.
ETHUSD monthly chart
The monthly chart above shows that price has been retracing from the technical resistance level at USD 4,800. It still remains important for Ethereum to continue trading above the USD 3,900 price level. While it would be ok to partly trade below that zone, the candle should trade above that level at the end of the month. Upside momentum might only be found with a clear break of the USD 4,500 level.
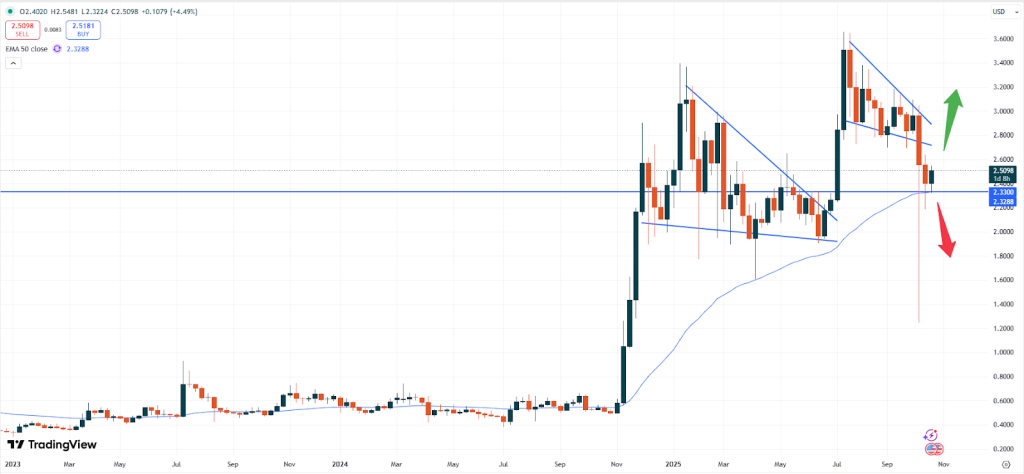
XRP – Ripple is currently trading at USD 2.5098. After the sharp fall and the break of the 50- moving average, the market seems to remain steady above the technical zone of USD 2.3300.
XRPUSD weekly chart
The weekly chart still shows that the market might offer fresh upside in the near future. The positive sentiment might increase above USD 2.5000. Beyond that level the price might increase towards the USD 3.000 area, where another attempt towards much higher levels might occur.
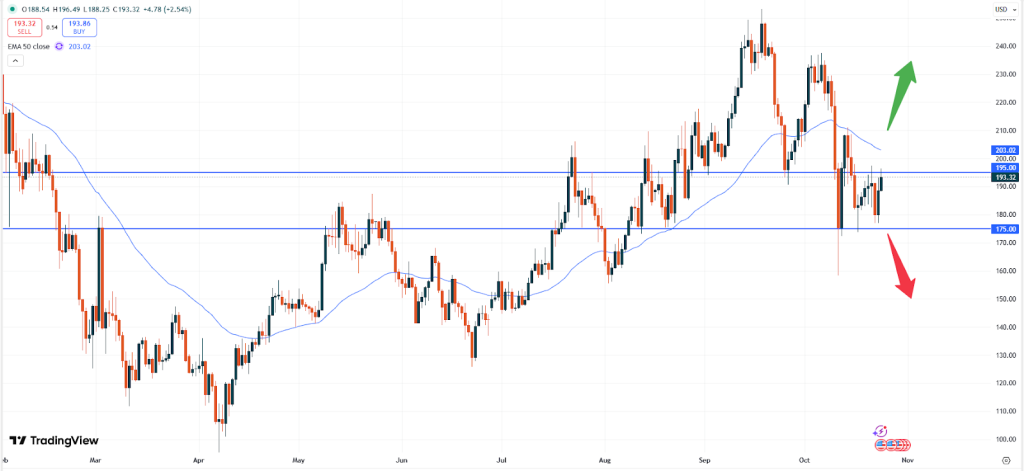
SOL – Solana is currently trading at USD 193.32. While the recent slide in prices had come to a halt also the upside remains limited. A break of the USD 195.00 level is needed, which could then push the market above the USD 203 resistance. That zone, where the 50- moving average currently sits needs to break to unleash fresh positivity.
SOLUSD daily chart
The daily chart above shows that the price looks reluctant to move higher for now. The market might remain in the current sideways trend until a clear breakout will occur. A break into either direction might then offer fresh entry opportunities for traders.
Vantage does not represent or warrant that the material provided here is accurate, current, or complete, and therefore should not be relied upon as such. The information provided here, whether from a third party or not, is not to be considered as a recommendation; or an offer to buy or sell; or the solicitation of an offer to buy or sell any financial instruments; or to participate in any specific trading strategy. Any research provided does not have regard to the specific investment objectives, financial situation and needs of any specific person who may receive it. We advise any readers of this content to seek their own advice. Without the approval of Vantage, reproduction or redistribution of this information is not permitted.