The recent negative momentum in the crypto market seems to fade for now, especially with equity markets moving higher. Furthermore, upside potential might also be observed since many traders remain on the sidelines believing that markets will fall further. Similar crowded expectations oftentimes led to the exact opposite direction in markets.
Some indicators also offer more insights here, with potentially bigger moves in the making.
The US- Dollar lost some strength again while geopolitical tensions have been easing.
Also trading volumes have been higher in Bitcoin over the past two months compared to the altcoin sector. In such phases in markets, the risk is being reduced. The demand of Bitcoin then typically rises while speculative assets rather lose value.
Technical analysis:
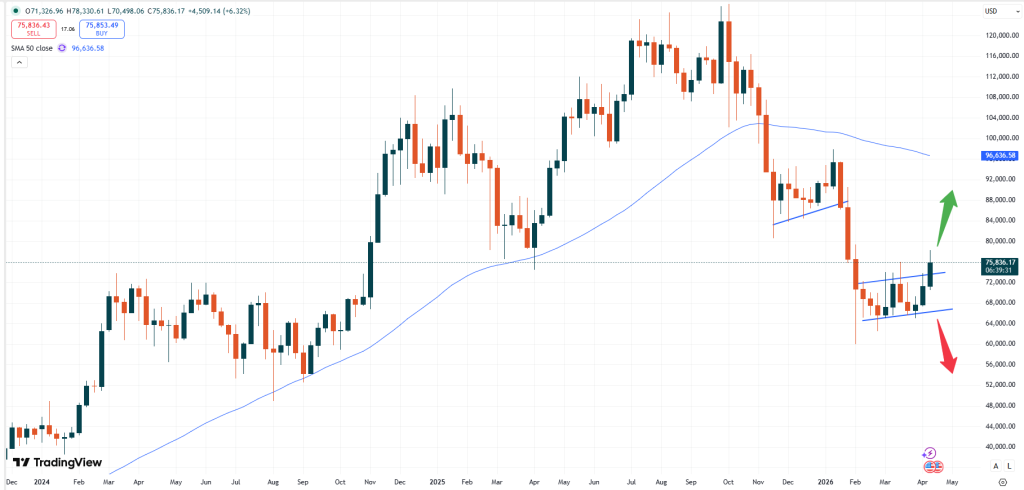
– BTC: Bitcoin is trading at USD 75,836. The positive risk sentiment of the equity market also helped Bitcoin to rise and hence the token was able to break above the technical resistance zone above USD 74,000 last week. Now, the upside seems to be open and if the positive sentiment will continue this might cause the market to rise further.
BTCUSD, weekly chart
Based on the general trend, however, the market might also start to move lower again. If the current sentiment will fade that could quickly escalate pushing BTC down. Traders should then focus on the support zone at around USD 67,000 to examine the further development of this market.
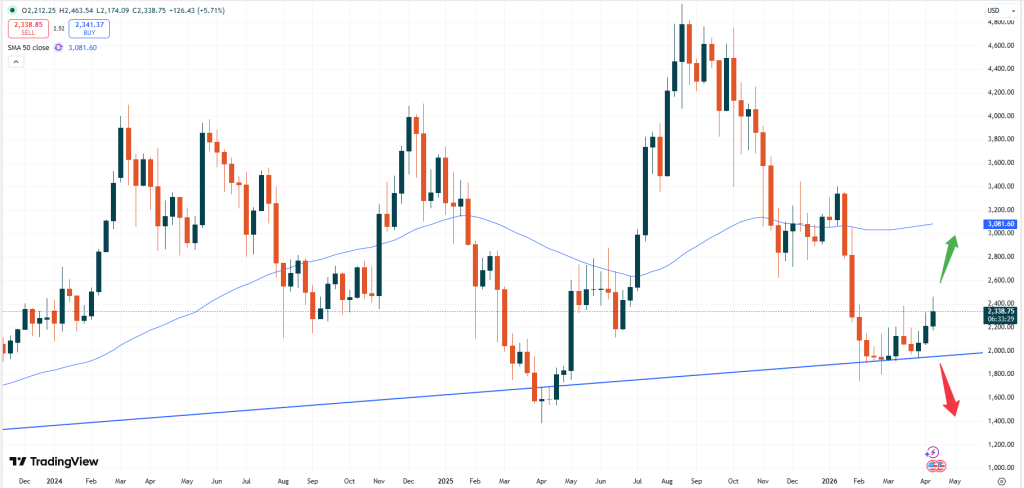
– ETH: Ethereum is trading at USD 2,338. Similar to Bitcoin also Ethereum has been moving upwards. Since the price has been breaking away off the technical USD 2,000 support level, more upside potential might now emerge.
ETHUSD, weekly chart
The upside in Ethereum is now open towards the 50- moving average level, which currently sits at about USD 3,085. Yet, the zone around USD 2,550 will also offer some resistance, potentially causing ETH to push lower again. The next moves will be determined by the development in geopolitics as well as the general news.
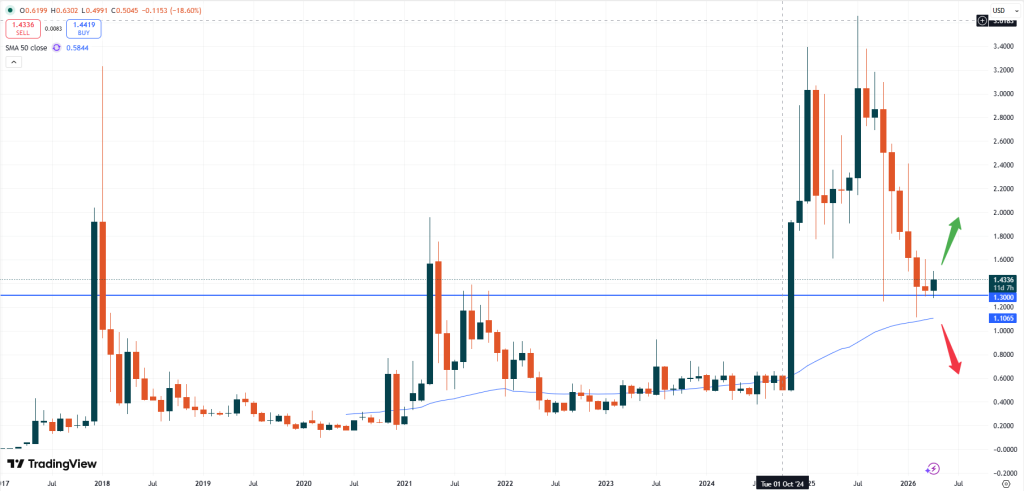
– XRP: Ripple is trading at USD 1.4336. The price of Ripple continues to trade above the technical support zone of USD 1.3000 and might hence push higher as well. However, the market has been lagging behind and failed to push above the USD 1.6000 level.
XRPUSD, monthly chart
Currently the odds that the market might fall further increase as XRP remains rather on the weaker side. A break below USD 1.3000 might then escalate losses quickly, pushing the price down towards parity.
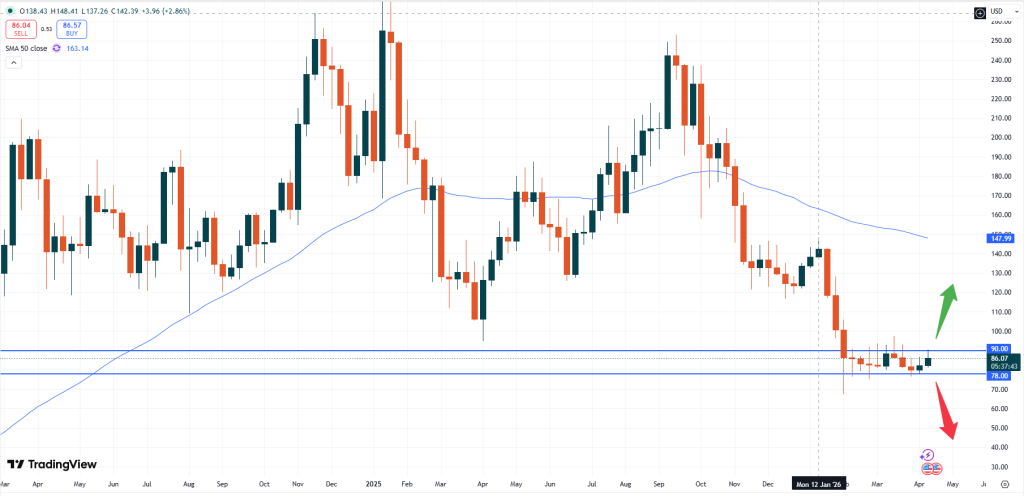
– SOL: Solana is trading at USD 86.02. Also, Solana was able to rise last week but failed to break recent highs at USD 90.00. The downside momentum might hence intensify. Especially a break below the USD 78.00 level might unleash fresh bearish momentum. A positive push might only occur, if the market is able to break the USD 100.00 zone.
SOLUSD, weekly chart
Yet, if the market will indeed be able to move upwards the next technical resistance zone will be the USD 106.00 area.
Vantage does not represent or warrant that the material provided here is accurate, current, or complete, and therefore should not be relied upon as such. The information provided here, whether from a third party or not, is not to be considered as a recommendation; or an offer to buy or sell; or the solicitation of an offer to buy or sell any financial instruments; or to participate in any specific trading strategy. Any research provided does not have regard to the specific investment objectives, financial situation and needs of any specific person who may receive it. We advise any readers of this content to seek their own advice. Without the approval of Vantage, reproduction or redistribution of this information is not permitted.