The Core Consumer Price Index (CPI) measures the changes in the price of goods and services, excluding food and energy. The CPI measures price change from the perspective of the consumer. It is a key way to measure changes in purchasing trends and inflation.
Core CPI declined in November to 0.2%, lower than the forecast of 0.3%. The Fed’s last rate hike was in December, and they increased with 50 bps. It is still too soon to expect rate hike reductions, and further increases are expected although not as aggressive as in 2022.
The report is due Thursday, 12 January 2023 @ 13:30 GMT.
Technical Analysis Daily Timeframe
Moving Average (MA):
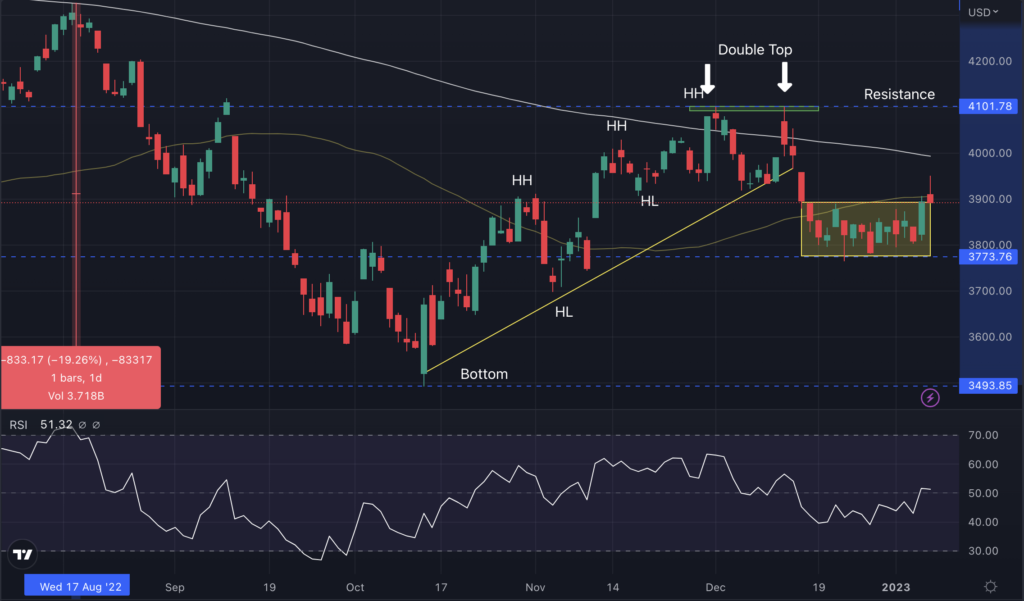
On the Daily timeframe, S&P 500 price is currently trading both below the 200 and the 50MA, showing bearish sentiment in the market.
Relative Strength Index (RSI):
The RSI line is at 51.32, showing slightly overbought sentiment.
Analysis using price action:
S&P 500 has seen a sharp decline in price from 25th Aug 2022 till 13th Oct 2022, with price cutting off 19.26% with 83317 pips. After 13th Oct, the price seems to be gathering more buyers and eliminating bear pressure. On the way up, the price first broke the lower high at $3806.91 and formed a new higher high at $3905.42.
With a series of higher highs and lows, the price broke above the 50MA and went up to 200MA. It halted at $4101.78, which is now acting as the most recent resistance. The second time the price couldn’t push higher and stopped at this region, forming the double-top pattern.
Considering the current price of the S&P 500 ($3891.2), the price from the recent high of $4100.96 is down by 5.10%. After forming the double top pattern, the price came down and entered a consolidation state, not breaking the high or low for two consecutive weeks. However, on Monday, 9th Jan 2023, the price broke above the range zone, still below the MAs.
If the S&P 500 gains bullish pressure and successfully breaks the previous high, making two consecutive higher highs and lows, it may trade further up. However, it might trade down if the price broke the range zone below and crossed the support at $3773.76.
Potential pivot points using Price Action:
Resistance Pivot
Support Pivot
R1
3931.00
S1
3834.37
R2
3966.91
S2
3773.65
R3
4027.63
S3
3737.74
This considerable resistance and support level can enter or exit when approaching future market openings.
Key Trading Recommendation
The S&P 500 tracks the performance of the 500 largest US companies. The index was on a bearish trend for 2022 as investors feared recession looming and sold off stocks to diversify their risks. CPI news results in high market volatility, especially stock indices, and traders should take caution when entering or holding trades during these instances.
Investors and traders eagerly await the CPI news that has declined for the last two months. The expectation is that rate hikes might be less aggressive in light of the declining inflation.
Traders should avoid entering positions during these news events since the market will have higher-than-average volatility, meaning that currencies could move in either direction without a definite trend for a short while.
Vantage does not represent or warrant that the material provided here is accurate, current, or complete, and therefore should not be relied upon as such. The information provided here, whether from a third party or not, is not to be considered as a recommendation; or an offer to buy or sell; or the solicitation of an offer to buy or sell any financial instruments; or to participate in any specific trading strategy. Any research provided does not have regard to the specific investment objectives, financial situation and needs of any specific person who may receive it. We advise any readers of this content to seek their own advice. Without the approval of Vantage, reproduction or redistribution of this information is not permitted.
Vantage does not represent or warrant that the material provided here is accurate, current, or complete, and therefore should not be relied upon as such. The information provided here, whether from a third party or not, is not to be considered as a recommendation; or an offer to buy or sell; or the solicitation of an offer to buy or sell any financial instruments; or to participate in any specific trading strategy. Any research provided does not have regard to the specific investment objectives, financial situation and needs of any specific person who may receive it. We advise any readers of this content to seek their own advice. Without the approval of Vantage, reproduction or redistribution of this information is not permitted.