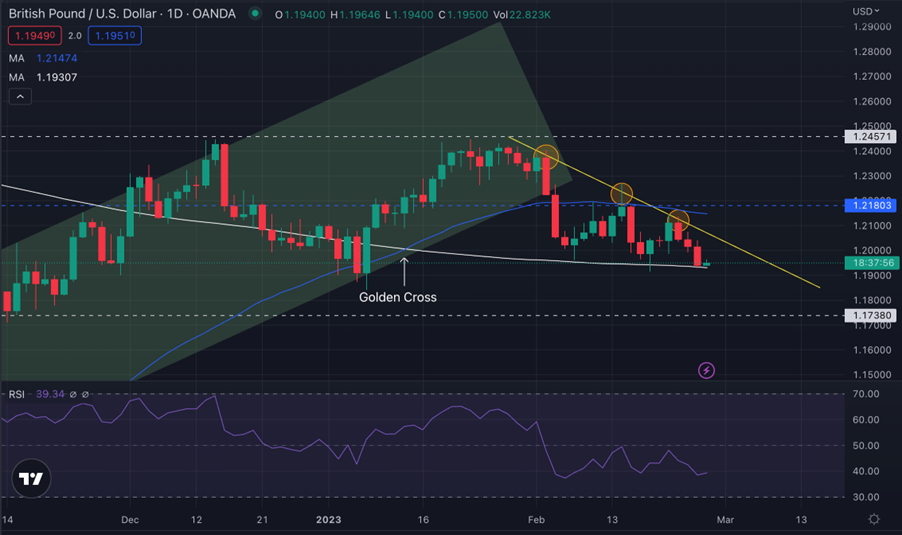
-GBPUSD is above the 200MA and respecting the bearish trend line
USA (USD): US Consumer Confidence – Conference Board (CB)
Consumer Confidence measures the level of consumer confidence in economic activity. It is a leading indicator as it can predict consumer spending, which plays a major role in overall economic activity. Higher readings point to higher consumer optimism. The last figure was 107.1, lower than the forecast of 109.0.
The report is due Tuesday, 28 February at 15:00 GMT
EUR/USD Technical Analysis:
Analysis using price action:
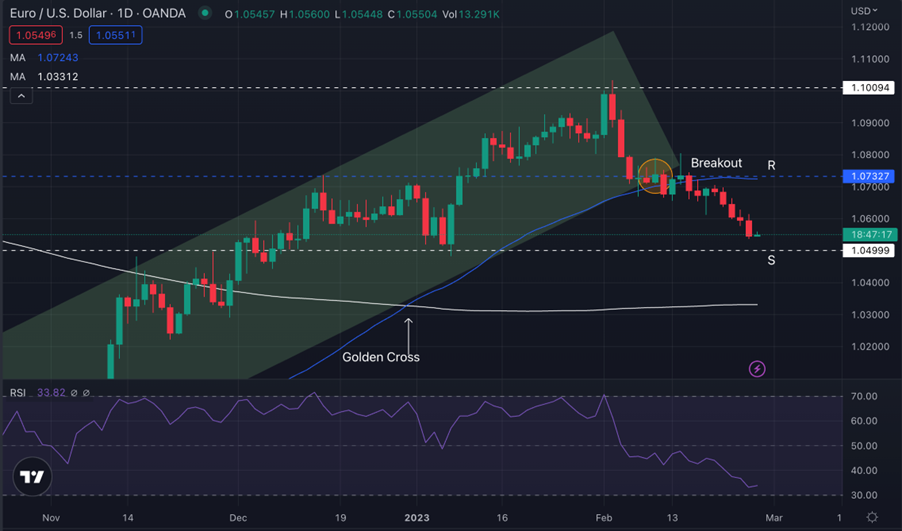
EURUSD is in the uptrend. The bottom was formed at $0.95383 on 28th Sept 2023. The market has risen by 12.06% from the bottom, accumulating 1150 pips.
The chart above shows that the market has gathered buyers, and fewer sellers mean the buying sentiment is higher. The price has been trading inside the bullish channel, not breaking any significant levels.
The MA formed a golden cross after the 50MA crossed above the 200MA on 30th Dec 2023, signaling the prices may go up higher. From the cross-formation, the market went up by 4.07%. The price later formed a swing high at $1.10330 on the 2nd Feb, after which the price immediately fell, successfully breaking the bullish channel.
The current high formed is at $1.08047 on 14th Feb. The market is trading below the new support and resistance at $1.04999 and $1.07327.
The RSI line is at 33.82, showing neutral overbought and oversold condition. Traders must wait for the price to either break above the resistance or below the support for a clear indication of where the price may be.
Pivot Points:
Support
Resistance
S1
1.0574
R1
1.0624
S2
1.0551
R2
1.0651
S3
1.0524
R3
1.0674
UK (GBP): UK Manufacturing PMI
The Manufacturing Purchasing Managers’ Index (PMI) measures the activity level of purchasing managers in the manufacturing sector. A reading above 50 indicates expansion in the sector; below 50 indicates contraction. Traders watch these surveys closely as purchasing managers usually have early access to data about their company’s performance, which can be a leading indicator of overall economic performance. The last number was 49.2, better than the forecast of 47.5.
The report is due Wednesday, 1 March at 09:30 GMT
GBP/USD Technical Analysis:
Analysis using price action:
GBPUSD was in a bullish phase until forming a high at $1.24571. The price had been trading inside a bullish channel. 50MA crossed above the 200MA showing bullish sentiment in the market. After the golden cross formation, the market rose by 3.18%, again touching the recent high and forming another price pattern – Double top.
The price here broke the bullish channel and started to trade down with a series of big bearish candles formation. Now the price is moving downward, respecting the bearish trend line.
The price is above the 200MA and below the 50MA. RSI is at 39.18, showing neutral overbought and sold condition. The latest breakout zone had become the new resistance at $1.21803 while the support is at $1.17380.
If the price breaks the bearish trendline and moves up, breaking the new resistance, it may trade further up. However, if the price breaks the support with more confluence, it may trade downwards.
Pivot Points:
Support
Resistance
S1
1.1980
R1
1.2064
S2
1.1944
R2
1.2112
S3
1.1897
R3
1.2147
Vantage does not represent or warrant that the material provided here is accurate, current, or complete, and therefore should not be relied upon as such. The information provided here, whether from a third party or not, is not to be considered as a recommendation; or an offer to buy or sell; or the solicitation of an offer to buy or sell any financial instruments; or to participate in any specific trading strategy. Any research provided does not have regard to the specific investment objectives, financial situation and needs of any specific person who may receive it. We advise any readers of this content to seek their own advice. Without the approval of Vantage, reproduction or redistribution of this information is not permitted.
Vantage does not represent or warrant that the material provided here is accurate, current, or complete, and therefore should not be relied upon as such. The information provided here, whether from a third party or not, is not to be considered as a recommendation; or an offer to buy or sell; or the solicitation of an offer to buy or sell any financial instruments; or to participate in any specific trading strategy. Any research provided does not have regard to the specific investment objectives, financial situation and needs of any specific person who may receive it. We advise any readers of this content to seek their own advice. Without the approval of Vantage, reproduction or redistribution of this information is not permitted.