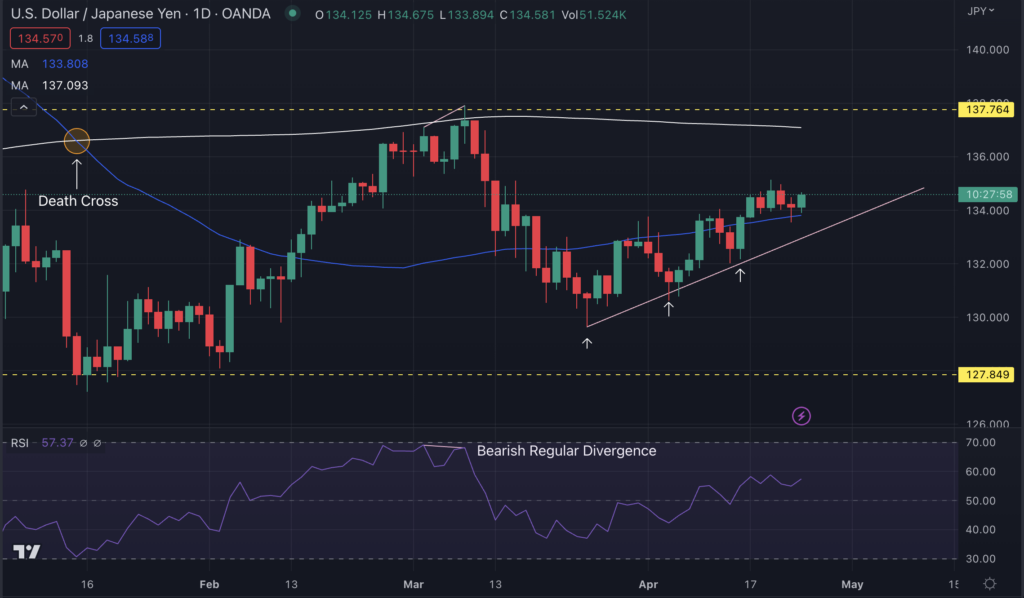
-USDJPY is bullish forming higher highs and lows and is trading below the resistance $137.76
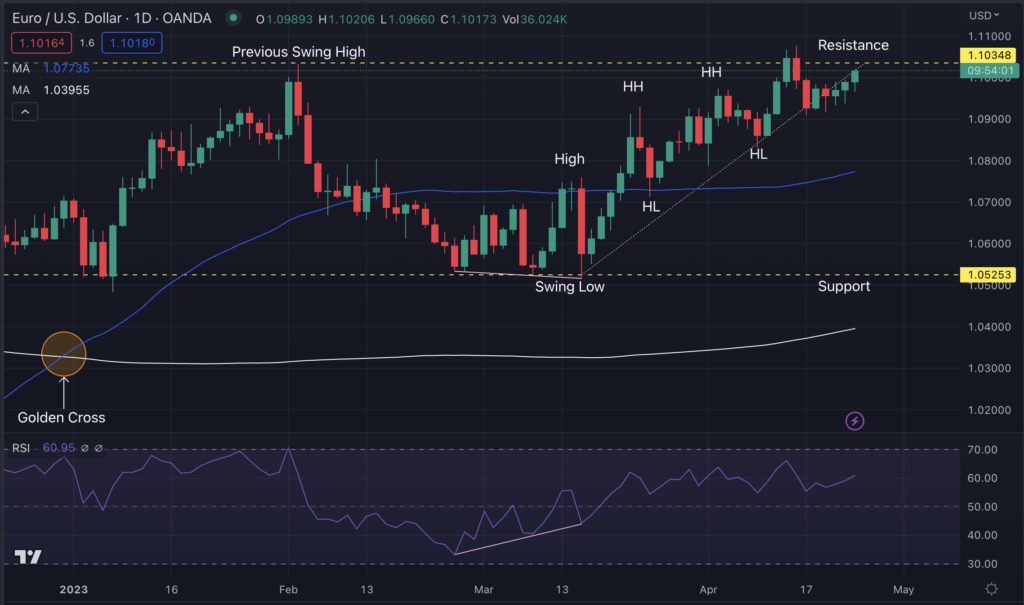
-EURUSD is trading near the resistance and might break above the resistance for BUY confirmation.
USA (USD): GDP (QoQ)
Gross Domestic Product (GDP) measures the annualized change in the inflation-adjusted value of all goods and services produced by the economy. It is the broadest measure of economic activity and the primary indicator of the economy’s health. The last GDP was 2.6%, less than the forecast of 2.7%.
The report is due Thursday, 27 April at 12:30 GMT
USDJPY Technial Analysis:
USDJPY is currently rising but still does not have a clear trend. A death cross formed on Fri 13th, January 2023; however, the pattern did not affect the price much. The price surged by 8.18% from the last low at $127.849 and formed a new swing high at $137.915 on Wed 8th, March. Here, the RSI formed a Bearish Regular Divergence pattern signifying the bearish trend is due.
However, the sellers were seen rushing into the trade, pushing the price down by almost $5.95%. The price crossed below both the 200 and 50MA, signaling the bearish pressure in the market. Currently, the price is on the rise forming higher highs and higher lows while respecting the bullish trend line. The RSI line is at 57.37, showing a slightly overbought condition.
Traders must wait for the price to either breach the bullish trend line for SELL confirmation or break a successful break of the swing high at $137.915 for BUY.
Pivot Points: USDJPY
Support
Resistance
S1
1.3451
R1
1.3494
S2
1.3428
R2
1.3514
S3
1.3408
R3
1.3538
USA (USD): NEW HOME SALES
New Home Sales measures the annualized number of new single-family homes that were sold during the previous month. This report tends to have more impact when it’s released ahead of Existing Home Sales because the reports are tightly correlated. New home sales were at 640K, lower than the forecast of 650K.
The report is due Tuesday, 25 April at 14:00 GMT
EURUSD Technial Analysis:
EURUSD trades between two major support and resistance levels – $1.05253 & $1.10348. Moving average crossover formed a golden cross where the market increased by almost 4.79% and formed the swing high. However, the sellers became strong in the next pullback and pulled the prices back to the level forming a support zone.
At this point, the price formed a regular bullish divergence signaling the bullish move is due. From there, the prices started to rise, with buyers in the market forming a higher high and higher low pattern. Currently, both the MAs are below the price showing bullish sentiment in the market.
Considering the overall bullish trend, traders may take a BUY call after the price breaks above the resistance zone.
Pivot Points: EURUSD
Support
Resistance
S1
1.0935
R1
1.0993
S2
1.0905
R2
1.1021
S3
1.0877
R3
1.1051
Vantage does not represent or warrant that the material provided here is accurate, current, or complete, and therefore should not be relied upon as such. The information provided here, whether from a third party or not, is not to be considered as a recommendation; or an offer to buy or sell; or the solicitation of an offer to buy or sell any financial instruments; or to participate in any specific trading strategy. Any research provided does not have regard to the specific investment objectives, financial situation and needs of any specific person who may receive it. We advise any readers of this content to seek their own advice. Without the approval of Vantage, reproduction or redistribution of this information is not permitted.
Vantage does not represent or warrant that the material provided here is accurate, current, or complete, and therefore should not be relied upon as such. The information provided here, whether from a third party or not, is not to be considered as a recommendation; or an offer to buy or sell; or the solicitation of an offer to buy or sell any financial instruments; or to participate in any specific trading strategy. Any research provided does not have regard to the specific investment objectives, financial situation and needs of any specific person who may receive it. We advise any readers of this content to seek their own advice. Without the approval of Vantage, reproduction or redistribution of this information is not permitted.