-NZDUSD is near a resistance and may break above it giving traders a BUYING opportunity.
-GBPUSD is in uptrend in long-term while showing range in short-term.
NEW ZEALAND (NZD): INTEREST RATES
The Reserve Bank of New Zealand (RBNZ) governor decides where to set the rate after consulting senior bank staff and external advisers. Traders watch interest rate changes closely as short term interest rates are the primary factor in currency valuation. New Zealand’s interest rate was set at 5.25%.
The report is due Wednesday, 24 May 02:00 GMT
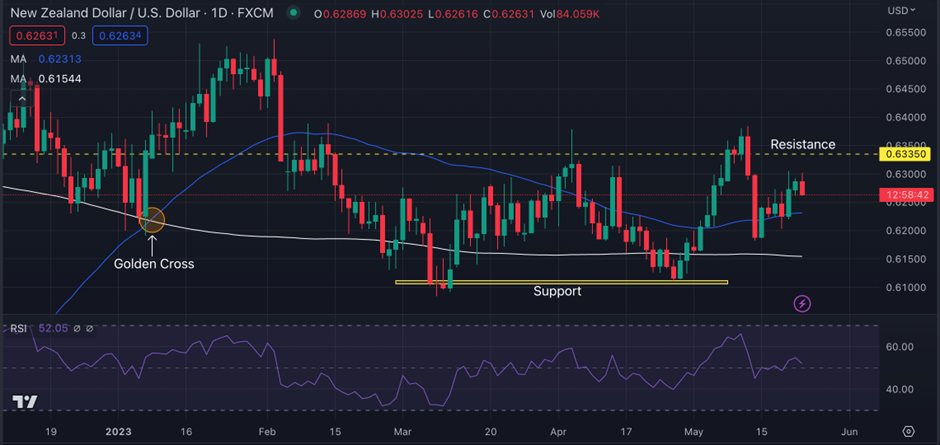
NZDUSD Technical Analysis:
NZDUSD is in range, with the price trading above both the 50 and 200MA. There was a Golden Cross formation on 9th Jan 2023, where the 50MA crossed the 200MA, signaling a short-term uptrend. Due to the pattern formation, the price surged by 5.14%. However, the price fell by 9.63% after a few trading weeks and halted at $0.60841, forming support.
Currently, the price is consolidated, with price trading between support and resistance of $0.63350 and $0.61143. The RSI level is $52.05, showing slight inclination towards the overbought sentiment. The overall chart analysis shows more buyer pressure as the price touched the support twice and still did not break below the support.
Traders may look for buying opportunities here by also considering the confluence and overall market trend.
Pivot Points: NZDUSD
Support
Resistance
S1
0.6196
R1
0.6263
S2
0.6166
R2
0.6300
S3
0.6128
R3
0.6330
UK (GBP) CPI (YOY)
The Consumer Price Index (CPI) measures the change in the price of goods and services from the perspective of the consumer. It is a key way to measure changes in purchasing trends and inflation. The UK’s CPI increased to 10.1%, higher than the forecast of 9,8%.
The report is due Wednesday, 24 May 06:00 GMT
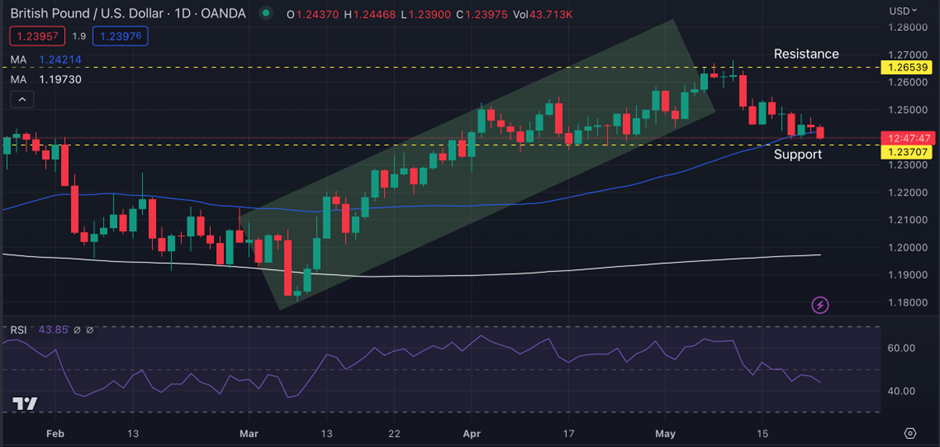
GBPUSD Technical Analysis:
The GBPUSD has been in an uptrend. The price has been trading inside a bullish channel. It made its high at $1.26800 on 10th May, which is now acting as a resistance. Both the moving average was below the price, signaling the overall trend was bullish until now, when the price crossed below the 50MA.
The RSI line is at 43.85, which is a neutral overbought and oversold condition. The price is between a support and resistance zone of $1.23707 and $1.26539. For now, the short-term trend may be down while the long-term trend shows bullish. Traders must wait for the break of either the support or the resistance for better trade confirmation and opportunities.
Pivot Points: GBPUSD
Support
Resistance
S1
1.2368
R1
1.2471
S2
1.2328
R2
1.2534
S3
1.2264
R3
1.2575
Vantage does not represent or warrant that the material provided here is accurate, current, or complete, and therefore should not be relied upon as such. The information provided here, whether from a third party or not, is not to be considered as a recommendation; or an offer to buy or sell; or the solicitation of an offer to buy or sell any financial instruments; or to participate in any specific trading strategy. Any research provided does not have regard to the specific investment objectives, financial situation and needs of any specific person who may receive it. We advise any readers of this content to seek their own advice. Without the approval of Vantage, reproduction or redistribution of this information is not permitted.
Vantage does not represent or warrant that the material provided here is accurate, current, or complete, and therefore should not be relied upon as such. The information provided here, whether from a third party or not, is not to be considered as a recommendation; or an offer to buy or sell; or the solicitation of an offer to buy or sell any financial instruments; or to participate in any specific trading strategy. Any research provided does not have regard to the specific investment objectives, financial situation and needs of any specific person who may receive it. We advise any readers of this content to seek their own advice. Without the approval of Vantage, reproduction or redistribution of this information is not permitted.