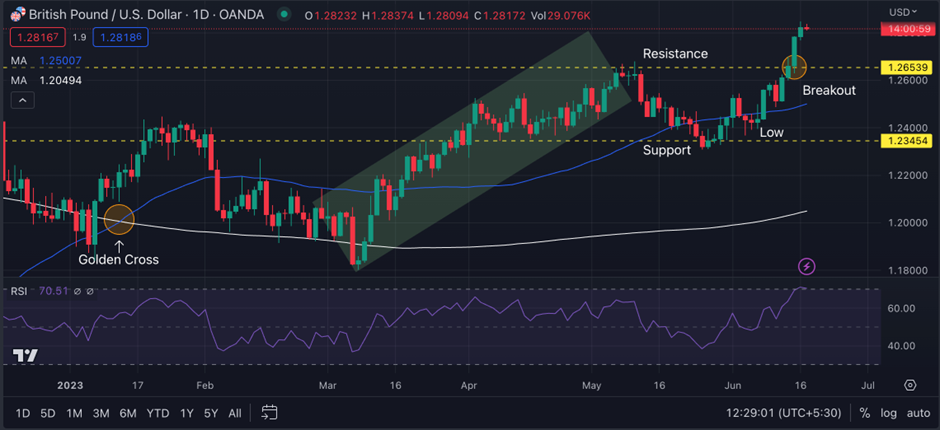
-GBPUSD has recently broken the resistance and is moving up.
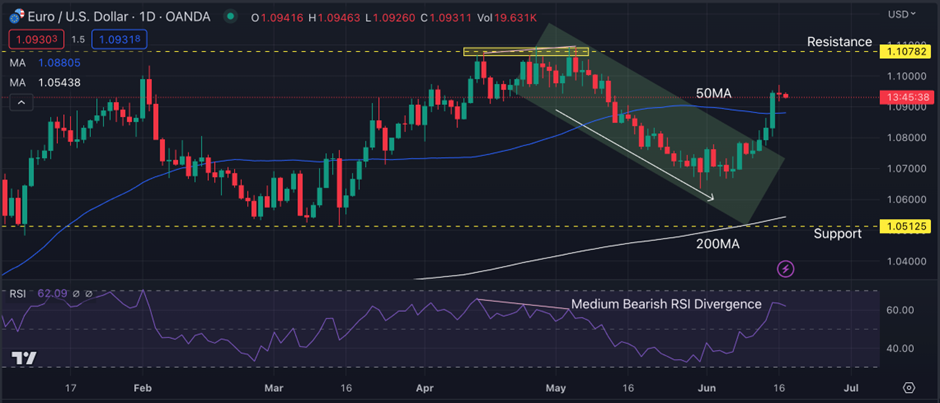
-EURUSD recently broke above the 50MA and the bullish channel. Traders might have a good trading opportunity when the price reaches the resistance.
UK (GBP): GBP CPI (YOY)
The Consumer Price Index (CPI) measures the change in the price of goods and services from the perspective of the consumer. It is a key way to measure changes in purchasing trends and inflation. The last CPI was 8.3%, higher than the forecast of 8.1%.
The report is due Wednesday, 21 June 06:00 GMT
GBPUSD Technical Analysis:
GBPUSD is in an uptrend and has recently broken the resistance. A golden cross was formed on the chart on 12th Jan 2023, with led to a price surge of 3.69%. A correction occurred in the subsequent trading sessions, pulling the price to a bottom of $1.18033.
The buyers entered the market, pushing the price and trading inside the bullish channel, halting and forming a resistance at $1.26539. The price then entered the consolidation state, trading between the support and resistance of $1.23454 and $1.26539.
Currently, the price is trading both above the 50 and 200MA while the RSI line is at 70.51 showing higher overbought sentiment of the asset. As GBPUSD is in an uptrend, traders must look into the overall confluence before entering the market. Recommended action is to wait for the price to form a break and retest pattern.
Pivot Points: GBPUSD
Support
Resistance
S1
1.2677
R1
1.2835
S2
1.2574
R2
1.2890
S3
1.2520
R3
1.2993
US (USD): INITIAL JOBLESS CLAIMS
Initial Jobless Claims measures the number of individuals who filed for unemployment insurance for the first time during the past week. This is the earliest U.S. economic data, but the market impact varies from week to week. Last week’s jobless claims came to 262K, higher than the forecast of 250K.
The report is due Thursday, 22 June 12:30 GMT
EURUSD Technical Analysis:
EURUSD was in a pull phase, with price trading inside the bearish channel. For a long, the price was trading above the 200MA and below the 50MA showing short-term due range movement.
There are multiple candle rejections around the psychological level of $1.10782, which the price touched thrice but could not break above it when the bulls were active and in control. The price of $1.10782 now is acting as a resistance.
When the multiple candle rejection pattern was formed, the RSI showed medium bearish RSI divergence signifying that bearish pressure was due, and in the next trading session, the sellers were in control until now when RSI showed the oversold condition, and the market came up. The price has recently broken the bearish channel and the 50MA.
The price is now very close to the resistance of $1.10782, which it tested twice in the previous trading sessions. Traders will have a good trading opportunity when the price is close to this resistance. If the price breaks above the resistance, traders may take BUY considering the overall market condition, while if the price does not break, the resistance market may come down.
Pivot Points: EURUSD
Support
Resistance
S1
1.0846
R1
1.0997
S2
1.0749
R2
1.1051
S3
1.0696
R3
1.1148
Vantage does not represent or warrant that the material provided here is accurate, current, or complete, and therefore should not be relied upon as such. The information provided here, whether from a third party or not, is not to be considered as a recommendation; or an offer to buy or sell; or the solicitation of an offer to buy or sell any financial instruments; or to participate in any specific trading strategy. Any research provided does not have regard to the specific investment objectives, financial situation and needs of any specific person who may receive it. We advise any readers of this content to seek their own advice. Without the approval of Vantage, reproduction or redistribution of this information is not permitted.
Vantage does not represent or warrant that the material provided here is accurate, current, or complete, and therefore should not be relied upon as such. The information provided here, whether from a third party or not, is not to be considered as a recommendation; or an offer to buy or sell; or the solicitation of an offer to buy or sell any financial instruments; or to participate in any specific trading strategy. Any research provided does not have regard to the specific investment objectives, financial situation and needs of any specific person who may receive it. We advise any readers of this content to seek their own advice. Without the approval of Vantage, reproduction or redistribution of this information is not permitted.