-USDJPY is trading inside a bullish channel and signals higher chances of continuation.
-GBPUSD has just formed a break and retest pattern, a good trading opportunity for the buyers.
USA (USD): GDP QOQ
Gross Domestic Product (GDP) measures the annualized change in the inflation-adjusted value of all goods and services produced by the economy. It is the broadest measure of economic activity and the primary indicator of the economy’s health. The last GDP increased to 1.3%, better than the forecast of 1.1%.
The report is due Thursday, 29 June 12:30 GMT
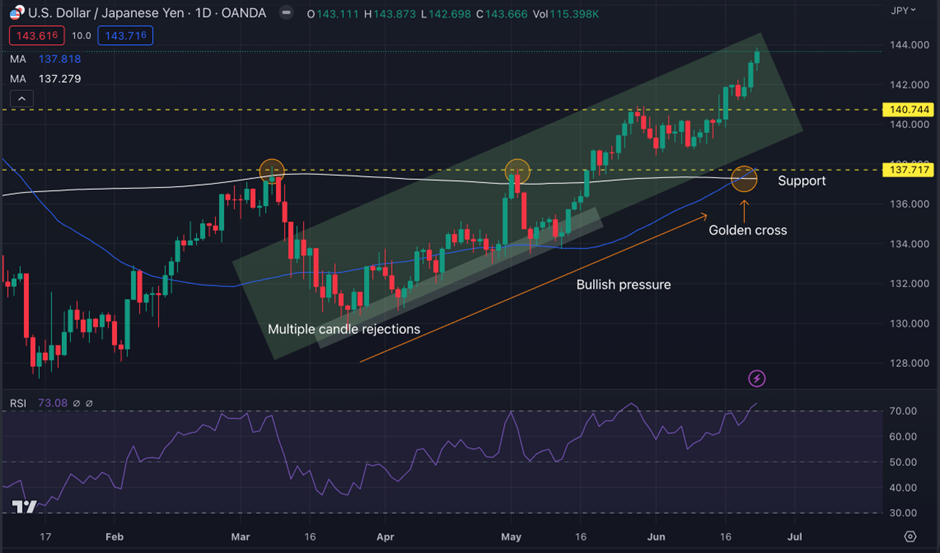
USDJPY Technical Analysis:
USDJPY is witnessing bullish pressure, as seen in the charts. The buyers have constantly controlled the price, with some major pullbacks to $129.50 forming the swing low. Here price tried going down but failed, forming multiple candle rejections with wicks also showing bullish sentiment and started trading inside the bullish channel.
The price crossed the previous resistance at a level of $137.717, breaking above it and continuing its bullish trend. On the way up, the price formed a higher high and a pullback. The price is trading both above the 50 and 200MA, signaling bullish pressure, while the RSI line is at 73.08, showing an overbought condition.
Traders may wait for a pullback and take a BUY call, also looking into the lower time frame. As all the confluence shows bullish pressure, traders should follow the trend.
Pivot Points: USDJPY
Support
Resistance
S1
140.41
R1
143.72
S2
141.01
R2
144.31
S3
142.06
R3
145.37
UK (GBP): GDP QOQ
Gross Domestic Product (GDP) measures the annualized change in the inflation-adjusted value of all goods and services produced by the economy. It is the broadest measure of economic activity and the primary indicator of the economy’s health. The UK’s GDP reached 0.1% during the last quarter.
The report is due Friday, 30 June 06:00 GMT
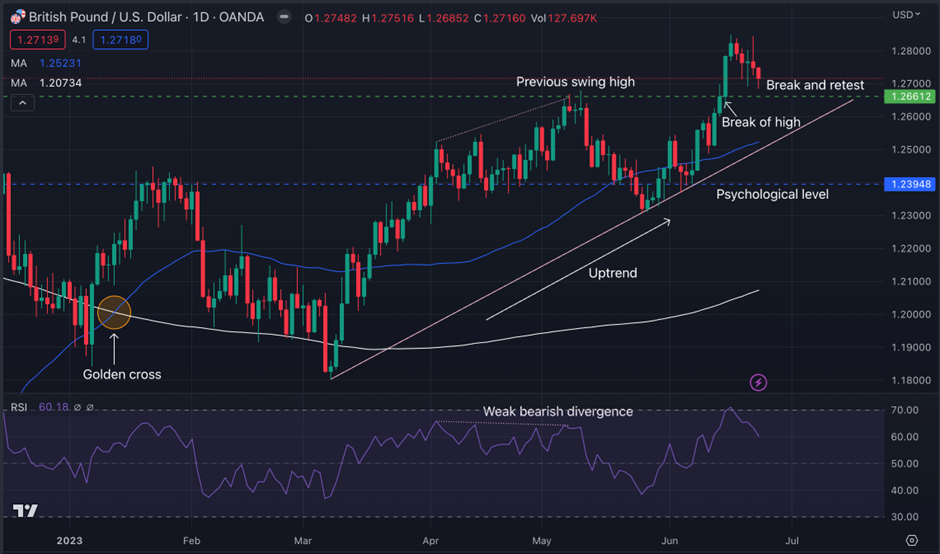
GBPUSD Technical Analysis:
GBPUSD is in uptrend on daily TF. There was a golden cross formation n 12th Jan 2023, which pushed the price by 2.93%, touching the psychological level. The level here acted as a resistance that bulls did not cross; instead, the price came down, breaking both the 50 and 200MA, forming a new bottom at $1.18078. The price now is trading on a bullish trend line, trading above both the MAs.
The RSI in April formed a weak bearish divergence meaning a short-term bearish move is due. After the RSI divergence formation, the price got pullback by 40% approx and started trading up again.
In the subsequent few trading sessions, the buyers entered the market, pushing the price up and breaking above the resistance of $1.26612. After the breakout, the price returned, testing the broken resistance zone. Here, the buyers have a good trading opportunity with extra confluence that the market will go up further long-term.
Pivot Points: GBPUSD
Support
Resistance
S1
1.2701
R1
1.2816
S2
1.2655
R2
1.2885
S3
1.2586
R3
1.2931
Vantage does not represent or warrant that the material provided here is accurate, current, or complete, and therefore should not be relied upon as such. The information provided here, whether from a third party or not, is not to be considered as a recommendation; or an offer to buy or sell; or the solicitation of an offer to buy or sell any financial instruments; or to participate in any specific trading strategy. Any research provided does not have regard to the specific investment objectives, financial situation and needs of any specific person who may receive it. We advise any readers of this content to seek their own advice. Without the approval of Vantage, reproduction or redistribution of this information is not permitted.
Vantage does not represent or warrant that the material provided here is accurate, current, or complete, and therefore should not be relied upon as such. The information provided here, whether from a third party or not, is not to be considered as a recommendation; or an offer to buy or sell; or the solicitation of an offer to buy or sell any financial instruments; or to participate in any specific trading strategy. Any research provided does not have regard to the specific investment objectives, financial situation and needs of any specific person who may receive it. We advise any readers of this content to seek their own advice. Without the approval of Vantage, reproduction or redistribution of this information is not permitted.