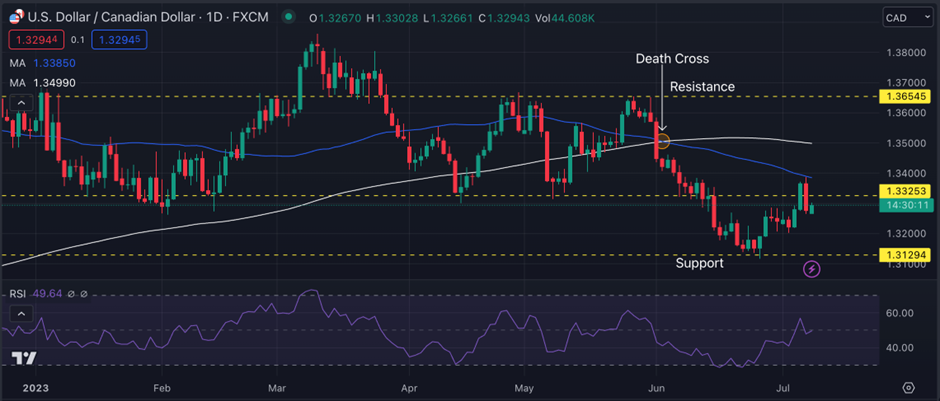
-USDCAD is under the sellers influence with both he MAs below the price. The price may break above the nearest resistance at $1.33253.
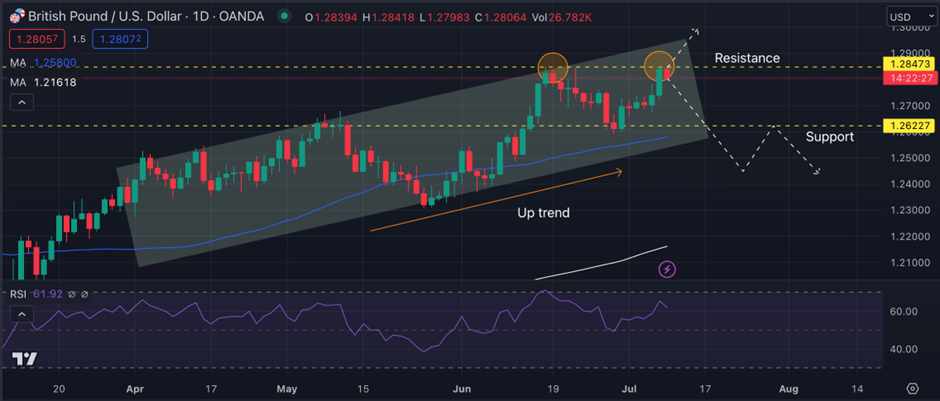
-GBPUSD is trading inside a bullish channel and is about to form a double-top pattern.
CANADA (CAD): BOC interest rate decision
Bank of Canada (BOC) governing council members come to a consensus on where to set the rate.Traders watch interest rate changes closely as short term interest rates are the primary factor in currency valuation. Canada’s interest rate is set at 4.75%.
The report is due Wednesday, 12 July 14:00 GMT
USDCAD Technical Analysis:
USDCAD is not in a strong trend but is seen inclined more toward bearish sentiment. Additionally, the price is trading below both the 200 and 50MA. The 50MA crossed below the 200MA, forming a death cross and signaling the price downward movement is due. In the new few trading weeks, the price was seen trading down by 2.49%, forming a swing low at $1.31166.
The price is in a push phase, forming a series of higher highs and lows but still trading below both MAs. The RSI line is at 49.64, showing the neutral overbought and oversold trading conditions. Traders here may wait for the immediate resistance of $1.33253 to be breached for a BUY trade, while if the price breaks below the support at $1.31294, traders may go for a SELL.
Pivot Points: USDCAD
Support
Resistance
S1
1.3271
R1
1.3283
S2
1.3264
R2
1.3288
S3
1.3259
R3
1.3295
UK (GBP): GDP (MOM)
Gross Domestic Product (GDP) measures the annualized change in the inflation-adjusted value of all goods and services produced by the economy. It is the broadest measure of economic activity and the primary indicator of the economy’s health. The UK’s month on month GDP rose to 0.2%.
The report is due Thursday, 13 July 06:00 GMT
GBPUSD Technical Analysis:
GBPUSD is in uptrend forming higher highs and higher lows. The price is trading both above the 50 and 200MA while trading inside the bullish channel, signaling the continuation of the trend. The chart shows the price trading between the support of $1.26227 and the resistance of $1.28473.
The double-top pattern is about to be formed if the price does not break above the resistance. However, if the price breaks above the resistance, the price may trade further up, while if the price comes down, it may trade below the support or go into a consolidation state. The RSI level is at 61.92, signaling a slight inclination towards an overbought condition. Traders at this should wait for the successful break of the levels for trade confirmation.
Pivot Points: GBPUSD
Support
Resistance
S1
1.2832
R1
1.2843
S2
1.2826
R2
1.2848
S3
1.2821
R3
1.2854
Vantage does not represent or warrant that the material provided here is accurate, current, or complete, and therefore should not be relied upon as such. The information provided here, whether from a third party or not, is not to be considered as a recommendation; or an offer to buy or sell; or the solicitation of an offer to buy or sell any financial instruments; or to participate in any specific trading strategy. Any research provided does not have regard to the specific investment objectives, financial situation and needs of any specific person who may receive it. We advise any readers of this content to seek their own advice. Without the approval of Vantage, reproduction or redistribution of this information is not permitted.
Vantage does not represent or warrant that the material provided here is accurate, current, or complete, and therefore should not be relied upon as such. The information provided here, whether from a third party or not, is not to be considered as a recommendation; or an offer to buy or sell; or the solicitation of an offer to buy or sell any financial instruments; or to participate in any specific trading strategy. Any research provided does not have regard to the specific investment objectives, financial situation and needs of any specific person who may receive it. We advise any readers of this content to seek their own advice. Without the approval of Vantage, reproduction or redistribution of this information is not permitted.