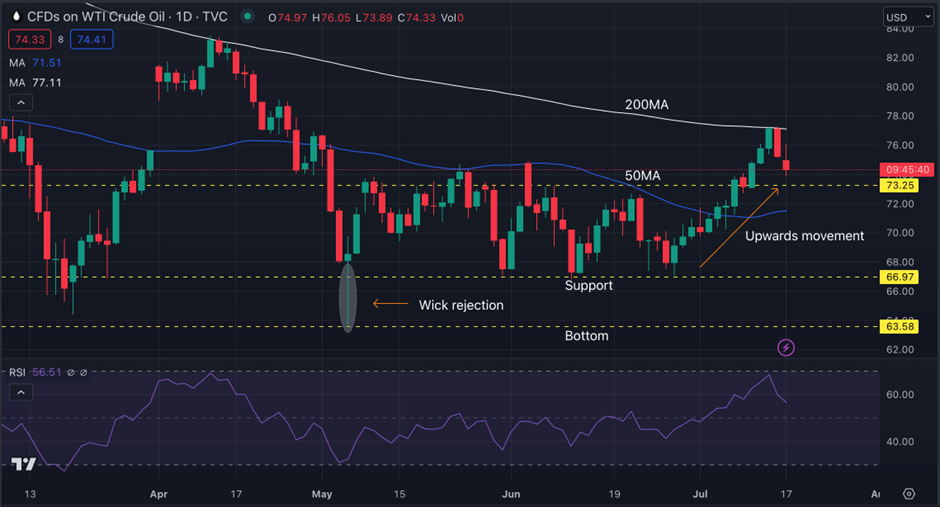
-WTI is trading right above the crucial support at 73.25. It may break this level or close above it, giving traders a good trading opportunity.
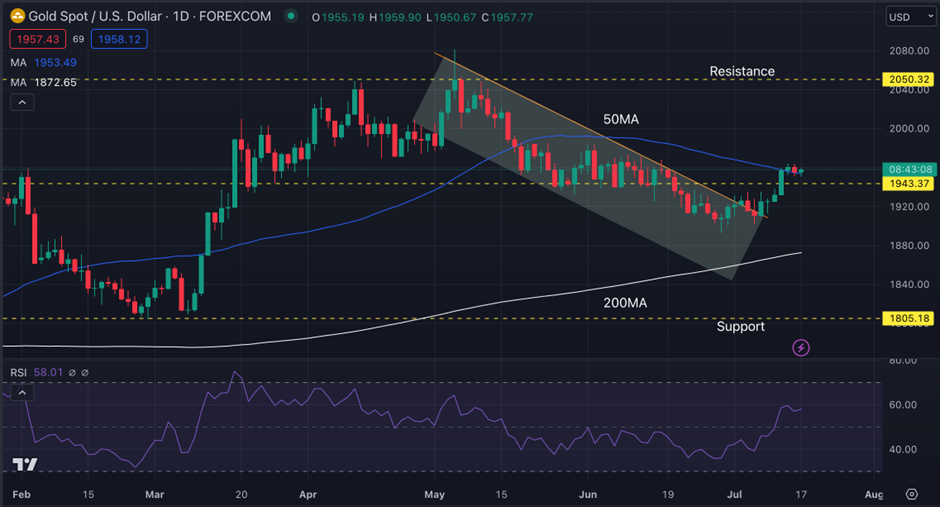
-XAUUSD does not have a clear trend but has recently broken the bearish channel resistance signifying the bulls are entering the market.
USA (USD): Crude Oil inventories
The Energy Information Administration’s (EIA) Crude Oil Inventories measures the weekly change in the number of barrels of commercial crude oil held by US firms. The level of inventories influences the price of petroleum products, which can have an impact on inflation. Last week’s number was 5.946M, higher than the forecast of 0.483M barrels.
The report is due Wednesday, 19 July 14:30 MT
WTI Technical Analysis:
WTI is slightly on the rising side but trading below the 200 moving average, which indicates the price still does not have much buying pressure. The price is currently trading at $74.44. The price was in a downfall from 13th April 2023 till 3rd May 2023, where the sellers tried pushing the price further down, due to which a hammer candle is formed in the chart on 4th May. This candle formation here shows the buyers rejected the price.
After this candle formation, the price consolidated for quite a while, trading between $66.97 and $73.25. In a few trading weeks, the price rose again by 15.44%, breaking above the resistance. On the way up, it also broke above the 50MA. The RSI level is 56.51, signaling a slight inclination towards an overbought condition.
Traders may wait for the price to close above the $73.25 level and take BUY by looking into extra confluence.
Pivot Points: WTI Crude oil
Support
Resistance
S1
74.57
R1
75.08
S2
74.30
R2
75.32
S3
74.06
R3
75.59
USA (USD): Jobless claims
Initial Jobless Claims measures the number of individuals who filed for unemployment insurance for the first time during the past week. This is the earliest U.S. economic data, but the market impact varies from week to week. Jobless claims for last week rose to 237K, lower than the forecast of 250K.
The report is due Thursday, 20 July 12:30 GMT
XAUUSD Technical Analysis:
XAUUSD is in a downtrend and was trading inside the bearish channel. The price recently broke above the diagonal resistance of the bearish channel. XAUUSD is now trading at $1949.20. The price trades above the 200 and 50MA with a very close support line near it.
The RSI line is at 58.61, indicating a slight overbought condition. From here, the price may shoot up until the immediate resistance at $2050.32 or trade below the price of $1943.37. Traders may have to look into a lower time frame for better trade confirmation.
Pivot Points: XAUUSD
Support
Resistance
S1
1955.50
R1
1959.80
S2
1953.46
R2
1962.05
S3
1951.20
R3
1964.10
Vantage does not represent or warrant that the material provided here is accurate, current, or complete, and therefore should not be relied upon as such. The information provided here, whether from a third party or not, is not to be considered as a recommendation; or an offer to buy or sell; or the solicitation of an offer to buy or sell any financial instruments; or to participate in any specific trading strategy. Any research provided does not have regard to the specific investment objectives, financial situation and needs of any specific person who may receive it. We advise any readers of this content to seek their own advice. Without the approval of Vantage, reproduction or redistribution of this information is not permitted.
Vantage does not represent or warrant that the material provided here is accurate, current, or complete, and therefore should not be relied upon as such. The information provided here, whether from a third party or not, is not to be considered as a recommendation; or an offer to buy or sell; or the solicitation of an offer to buy or sell any financial instruments; or to participate in any specific trading strategy. Any research provided does not have regard to the specific investment objectives, financial situation and needs of any specific person who may receive it. We advise any readers of this content to seek their own advice. Without the approval of Vantage, reproduction or redistribution of this information is not permitted.