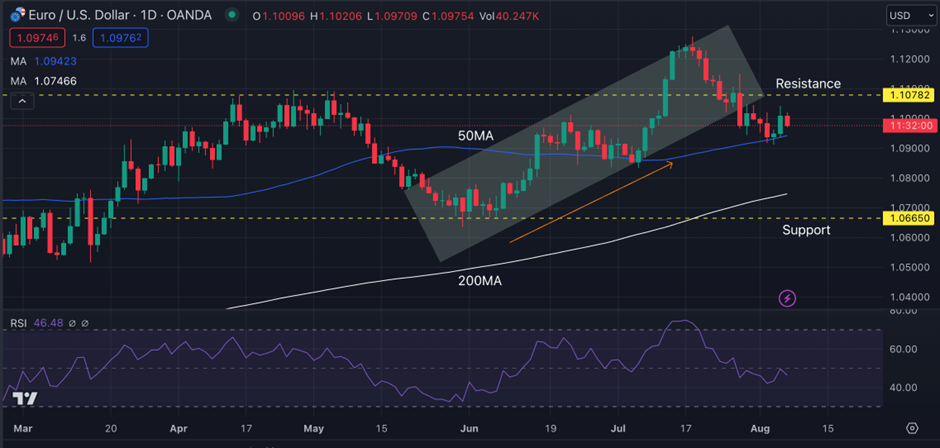
-EURUSD price broke below the bullish channel still trading below the resistance.
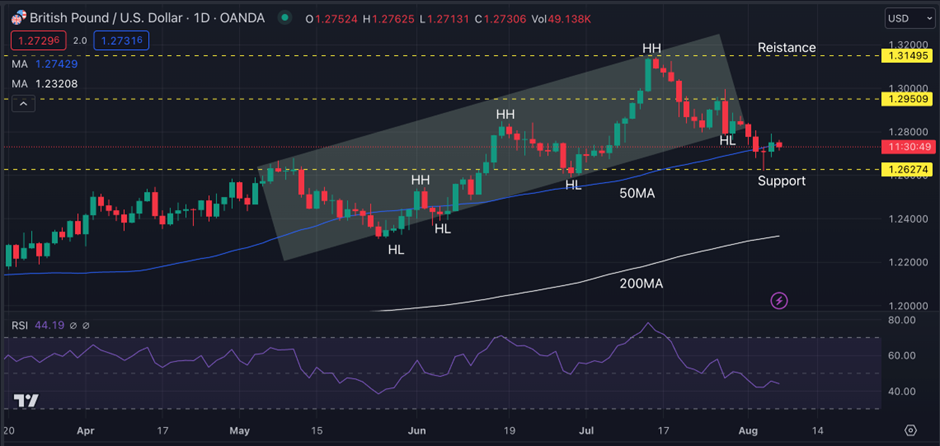
-GBPUSD, the price tried breaking below the 50MA but failed as a Doji candle formation, signifing the bears are struggling to take the price down
USA (USD): Core CPI (MoM)
The Core Consumer Price Index (CPI) measures the changes in the price of goods and services, excluding food and energy. The CPI measures price change from the perspective of the consumer. It is a key way to measure changes in purchasing trends and inflation.
The Actual Core CPI was 0.2% while the forecast was 0.3%. The Core CPI is due Thursday, August 10, 2023 at 18:00 GMT.
EURUSD Technical Analysis:
EURUSD is in uptrend trading both above the 50 and 200MA. The price has also been seen trading inside the bullish channel until now. The bullish channel is breached, trading below the diagonal support line.
Just right above the current price, there is a resistance that the price is struggling to break; however, we see the price just now touched the 50MA but did not break it, meaning it does not have enough bears in the market.
We see an immediate support level at $1.08501. The price is trading between these support and resistance zones ($1.08501 and $1.10782). The RSI level is at 46.48, signalling a slight inclination towards oversold conditions. Traders are recommended to wait for either the support or the resistance level to breach. If the price makes higher highs and lows breaking above the resistance, traders may go for a sell call as the overall trend remains bullish.
Pivot Points: EURUSD
Support
Resistance
S1
1.0968
R1
1.0986
S2
1.0961
R2
1.0999
S3
1.0949
R3
1.1005
U.K. Gross Domestic Product (GDP) MoM
Gross Domestic Product (GDP) measures the annualized change in the inflation-adjusted value of all goods and services produced by the economy. It is the broadest measure of economic activity and the primary indicator of the economy’s health.
The last’s month’s report actual report was -0.1% while the forecast was -0.3%. Friday, August 11, 2023 at 11:30GMT.
GBPUSD Technical Analysis:
The GBPUSD has been in an uptrend. The price has been trading inside a bullish channel until now, as the price recently broke below the channel. It made its high at $1.26800 on 10th May, which is now acting as a resistance. Both moving averages were below the price, signalling the overall trend was bullish.
The price tried breaking below the 50MA but failed as a Doji candle has been seen, which signifies the bears are struggling to take the price down. At this point, the price was very close to the support of $1.29509; tried breaking it but couldn’t.
The RSI line is at 44.19, which is a neutral overbought and oversold condition. The price is between a support and resistance zone of $1.26274 and $1.29509.
Traders must wait for the break of either the support or the resistance for better trade confirmation and opportunities.
Pivot Points: GBPUSD
Support
Resistance
S1
1.2718
R1
1.2741
S2
1.2708
R2
1.2754
S3
1.2695
R3
1.2765
Vantage does not represent or warrant that the material provided here is accurate, current, or complete, and therefore should not be relied upon as such. The information provided here, whether from a third party or not, is not to be considered as a recommendation; or an offer to buy or sell; or the solicitation of an offer to buy or sell any financial instruments; or to participate in any specific trading strategy. Any research provided does not have regard to the specific investment objectives, financial situation and needs of any specific person who may receive it. We advise any readers of this content to seek their own advice. Without the approval of Vantage, reproduction or redistribution of this information is not permitted.
Vantage does not represent or warrant that the material provided here is accurate, current, or complete, and therefore should not be relied upon as such. The information provided here, whether from a third party or not, is not to be considered as a recommendation; or an offer to buy or sell; or the solicitation of an offer to buy or sell any financial instruments; or to participate in any specific trading strategy. Any research provided does not have regard to the specific investment objectives, financial situation and needs of any specific person who may receive it. We advise any readers of this content to seek their own advice. Without the approval of Vantage, reproduction or redistribution of this information is not permitted.