-EURUSD trading up significantly making the second higher high near $1.13000 which is also a physiological level.
U.S. New Home Sales
New Home Sales measures the annualized number of new single-family homes that were sold during the previous month. This report tends to have more impact when it’s released ahead of Existing Home Sales because the reports are tightly correlated. The previous data was 697k while the forecast was 725k.
The report is due Wednesday, August 23, 2023 19:30 GMT
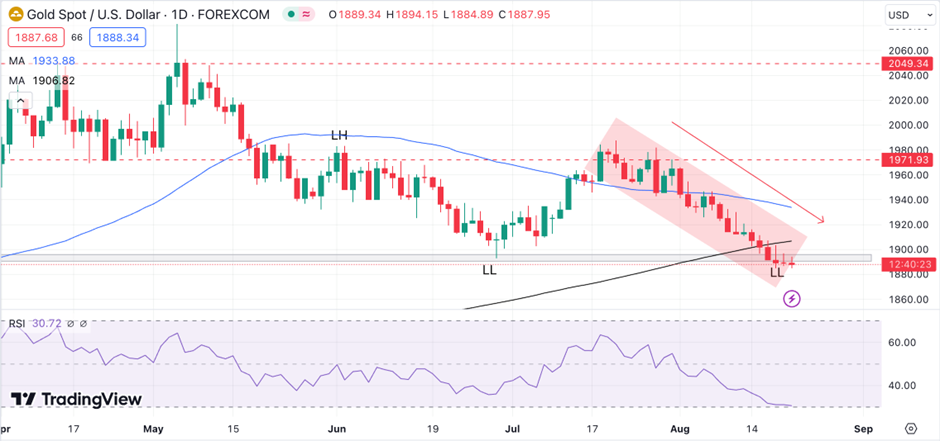
XAUUSD Technical Analysis:
XAUUSD Chart shows market trading under bearish pressure. The price is on the verge of breaking the support at $1891.1. The high was formed at $2081.0, after which the price started to slide down. After making a series of lower highs and lower lows, the price almost broke the most recent swing high near the $1971.93 zone.
With the current scenario, the price is trading below both the moving average, signifying the price may trade further down. The RSI line is at 30.71, which shows oversold sentiment. However, there is not much confluence, but it is better to trade with the trend.
Pivot Points: XAUUSD
Support
Resistance
S1
1887.24
R1
1889.77
S2
1886.36
R2
1891.42
S3
1884.71
R3
1892.30
U.S. Initial Jobless Claims
Initial Jobless Claims measures the number of individuals who filed for unemployment insurance for the first time during the past week. This is the earliest U.S. economic data, but the market impact varies from week to week. The previous actual data was 248k while the forecast was 230k.
The report is due Thursday, August 24, 2023 18:00 GMT
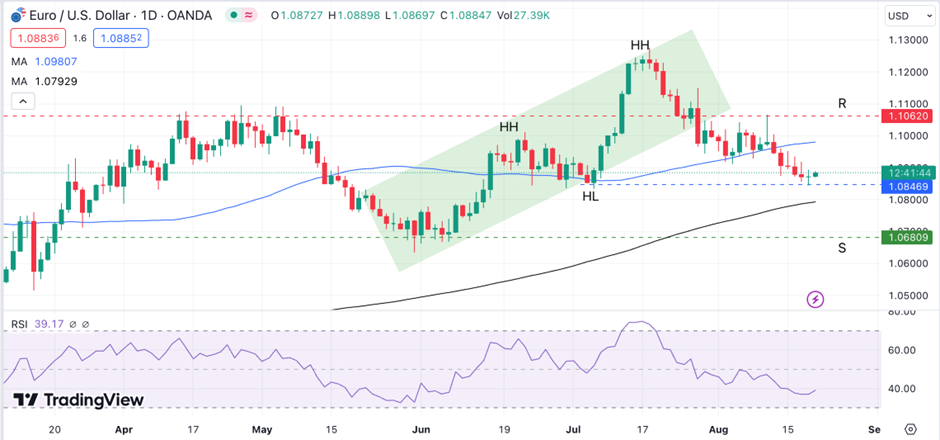
EURUSD Technical Analysis:
EURUSD as clearly shown in the chart is in an uptrend forming higher highs and lows. The first resistance hurdle came at $1.10620, which the price could not break, instead trading below and forming the swing low forming support.
After this, the price started trading up, crossing the 50MA while the 200MA was still trading below the price. The first high was formed near $1.10620, following a swing low right above the 50MA. After testing the resistance twice, the price broke the level, trading up significantly, making the second higher high near $1.13000, which is also a physiological level.
Currently, the price is in a pullback phase breaking the previous resistance turned support. Now the price is at $1.08469, trading above the 200MA and below the 50MA signalling range movement short-term. The RSI level is at 39.17, showing an overbought condition.
Pivot Points: EURUSD
Support
Resistance
S1
1.0877
R1
1.0894
S2
1.0867
R2
1.0899
S3
1.0861
R3
1.0910
Vantage does not represent or warrant that the material provided here is accurate, current, or complete, and therefore should not be relied upon as such. The information provided here, whether from a third party or not, is not to be considered as a recommendation; or an offer to buy or sell; or the solicitation of an offer to buy or sell any financial instruments; or to participate in any specific trading strategy. Any research provided does not have regard to the specific investment objectives, financial situation and needs of any specific person who may receive it. We advise any readers of this content to seek their own advice. Without the approval of Vantage, reproduction or redistribution of this information is not permitted.
Vantage does not represent or warrant that the material provided here is accurate, current, or complete, and therefore should not be relied upon as such. The information provided here, whether from a third party or not, is not to be considered as a recommendation; or an offer to buy or sell; or the solicitation of an offer to buy or sell any financial instruments; or to participate in any specific trading strategy. Any research provided does not have regard to the specific investment objectives, financial situation and needs of any specific person who may receive it. We advise any readers of this content to seek their own advice. Without the approval of Vantage, reproduction or redistribution of this information is not permitted.