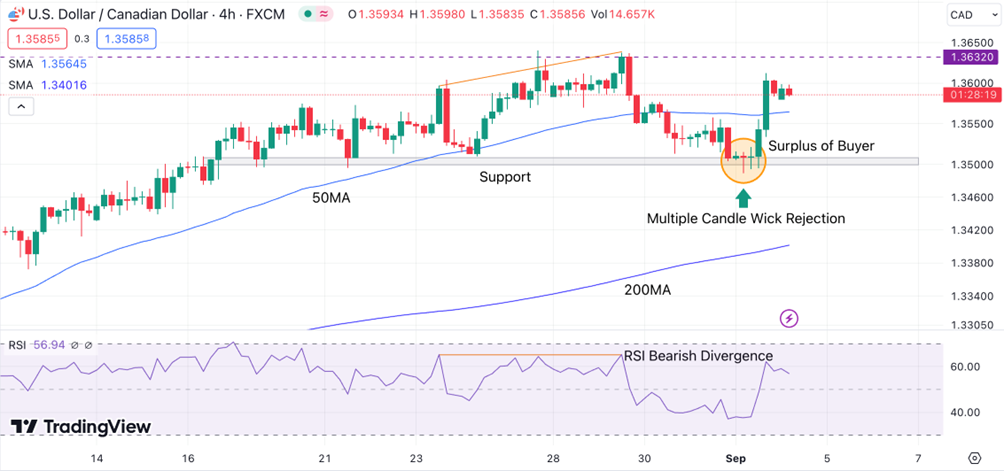
-USDCAD took the support at $1.35050 and shoot up significantly 0.77%.
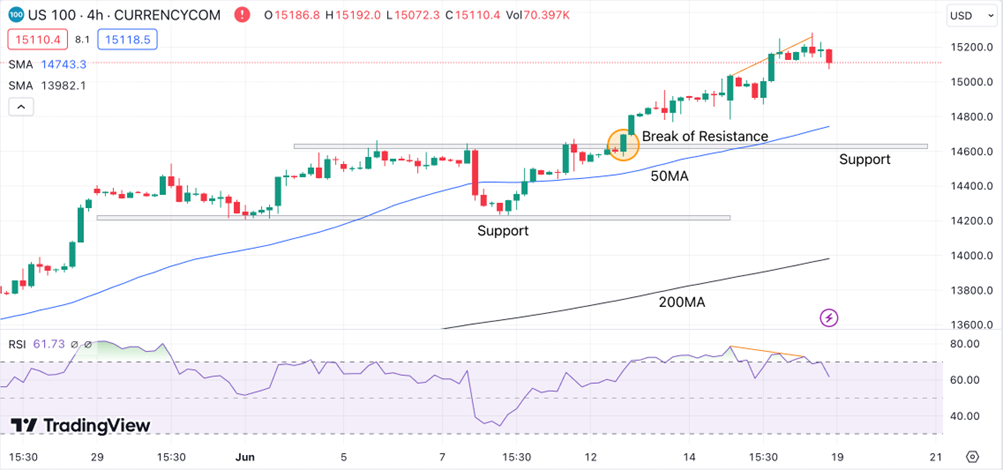
-The RSI divergence is formed in US100 suggesting the traders the market may trade bearish short-term.
Canada Interest Rate Decision
Bank of Canada (BOC) governing council members come to a consensus on where to set the rate.Traders watch interest rate changes closely as short term interest rates are the primary factor in currency valuation.
The previous data was 5.0% which is same as the forecast. The report is due, Wednesday, September 6, 19:30 GMT
USDCAD Technical Analysis:
USDCAD was in an uptrend, trading both above the 50 and 200MA. The market went up and reached a high of 1.36320. The chart shows the price forming higher highs and lows, followed by a big pullback to the support zone previously formed at 1.35050.
At this point, the candles show multiple wick rejections from the buyers, showing bullish pressure in a bearish phase. Analysing that there is a Surplus of Buyers, the price is pushed to the upside. The RSI line shows 56.94, slightly inclined towards the overbought sentiment. The information to look at is the RSI Bearish Divergence formation before the pullback phase.
The RSI Divergence was a signal that the bearish momentum was due. There is a resistance at $1.36320, and the price is trading between the support and resistance. Traders can look into the overall trend(BUY) with some extra confluence to take their trades.
Pivot Points: USDCAD
Support
Resistance
S1
1.3583
S1
1.3595
S2
1.3578
R2
1.3602
S3
1.3571
R3
1.3607
U.S. Initial Jobless Claims
Initial Jobless Claims measures the number of individuals who filed for unemployment insurance for the first time during the past week. This is the earliest U.S. economic data, but the market impact varies from week to week.
The previous actual data was 228k while the forecasted data was 235k. The report is due Thursday, September 7, 18:00 GMT
US100 Technical Analysis:
US100 was in an uptrend, with both the moving average trading below the price, signalling strong bullish pressure. The first strong support was $14215, where the price was held for a reasonable trading session until 12th June, when the price broke the range moving up. The break was sharp with a big bullish engulfing candle.
After breaking the resistance level at $14621, the price moves, forming higher highs and lows. The RSI level is at 61.73, and we can see an RSI bearish divergence, signalling the bearish movement is due. With the support at a far distance, traders can trade using the break and retest strategy of the previous high.
Pivot Points: US100
Support
Resistance
S1
15463.22
R1
15501.23
S2
15441.88
R2
15517.90
S3
15425.20
R3
15539.24
Vantage does not represent or warrant that the material provided here is accurate, current, or complete, and therefore should not be relied upon as such. The information provided here, whether from a third party or not, is not to be considered as a recommendation; or an offer to buy or sell; or the solicitation of an offer to buy or sell any financial instruments; or to participate in any specific trading strategy. Any research provided does not have regard to the specific investment objectives, financial situation and needs of any specific person who may receive it. We advise any readers of this content to seek their own advice. Without the approval of Vantage, reproduction or redistribution of this information is not permitted.
Vantage does not represent or warrant that the material provided here is accurate, current, or complete, and therefore should not be relied upon as such. The information provided here, whether from a third party or not, is not to be considered as a recommendation; or an offer to buy or sell; or the solicitation of an offer to buy or sell any financial instruments; or to participate in any specific trading strategy. Any research provided does not have regard to the specific investment objectives, financial situation and needs of any specific person who may receive it. We advise any readers of this content to seek their own advice. Without the approval of Vantage, reproduction or redistribution of this information is not permitted.