In the dynamic world of cryptocurrencies, we find the global market cap currently standing tall at $1.26 trillion, reflecting a modest 0.19% increase from the previous day. Meanwhile, the total crypto market volume over the last 24 hours has settled at $23.33 billion, indicating a 30.13% decrease.
Delving deeper, the decentralized finance (DeFi) sector continues to hold its ground with a volume of $2.57 billion, contributing to 11.00% of the total crypto market 24-hour volume. Additionally, stablecoins are commanding a significant presence, boasting a volume of $20.07 billion, making up 85.99% of the total crypto market 24-hour volume.
Shifting our focus to Bitcoin, the flagship cryptocurrency boasts a dominance rate of 53.00%, marking a slight increase of 0.07% over the day. Notably, the fear and greed index is currently at 71, reflecting a prevailing sentiment of greed among investors.
BTC: BTC price increased by 0.78% and 15.10% over 24 hours and the past seven days. The asset reached a low and high of $33,947.57 and $34,561.56, respectively.
The cryptocurrency market is enthusiastic about the potential approval of a Bitcoin spot price-based Exchange-Traded Fund (ETF) in the United States. This excitement resonates throughout the cryptocurrency ecosystem, leading to a notable resurgence in demand for institutional investment options.
Investors and institutions are closely monitoring developments, hopeful for regulatory approval. If granted, a Bitcoin ETF could provide traditional investors with a regulated entry point into the crypto space, potentially transforming the industry’s dynamics.
BTC Technical Analysis:
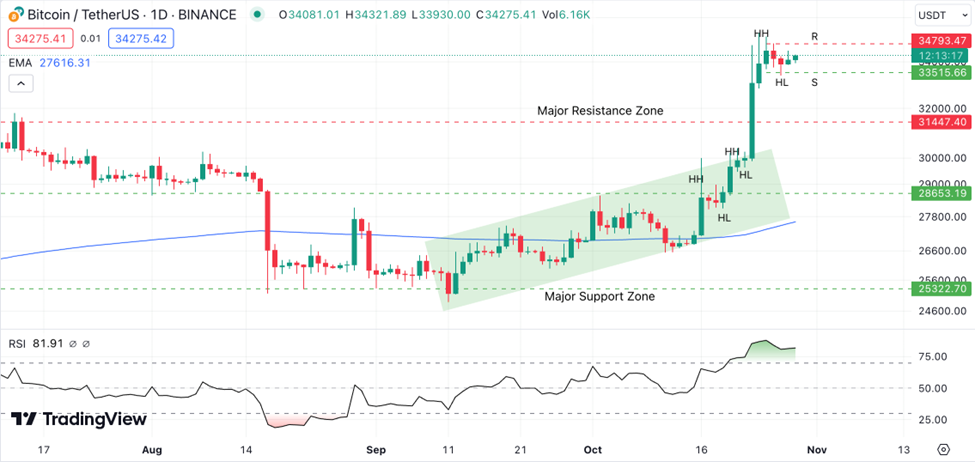
BTC has been seen at a low price zone, around $25500.00, for quite some time now. However, the recent surge in the price is drastic. Price on Sept 20th broke its first previous high, after which the price started to form a bullish pathway(higher high and lower high). On the way up, the price also broke the 200EMA, showing buyer sentiment in the market.
The price took the support of the EMA and went further up. Moreover, it has also broken the short-term bullish channel that was recently formed. The price has broken the major resistance zone at $31227.40 and has formed a new swing high at around $35132.00.
The current resistance stands at $34793.47, and the price is trading between $33515.66 and $34793.47. Traders must wait for the break of either the support or the resistance with multiple confluences.
Based on our analysis, Bitcoin is anticipated to experience a significant uptick, with a projected increase of 22.83%, reaching $42,149 by November 4, 2023. Our technical indicators are signalling a bullish sentiment, aligning with a Fear & Greed Index reading of 68 (Greed). Notably, Bitcoin has seen 17 out of the last 30 days marked as green, signifying a 57% positive trend amidst a 9.12% price volatility over the past month.
Support
Resistance
S1
34256.6
R1
34453.5
S2
34161.4
R2
34555.2
S3
34059.7
R3
34650.3
ETH: ETH price increased by 0.17% and 9.81% over 24 hours and the past seven days. The asset reached a low and high of $1,766.05 and $1,800.41, respectively.
Ethereum has recently separated Ethereum Request for Comments (ERC) and Ethereum Improvement Proposals (EIP) into separate GitHub repositories.
ERC’s focus is now on maintaining Ethereum application layer documentation, while EIP is dedicated to improving Ethereum’s underlying consensus mechanisms. This organizational shift aims to streamline development and documentation efforts within the Ethereum ecosystem.
ETH Technical Analysis:
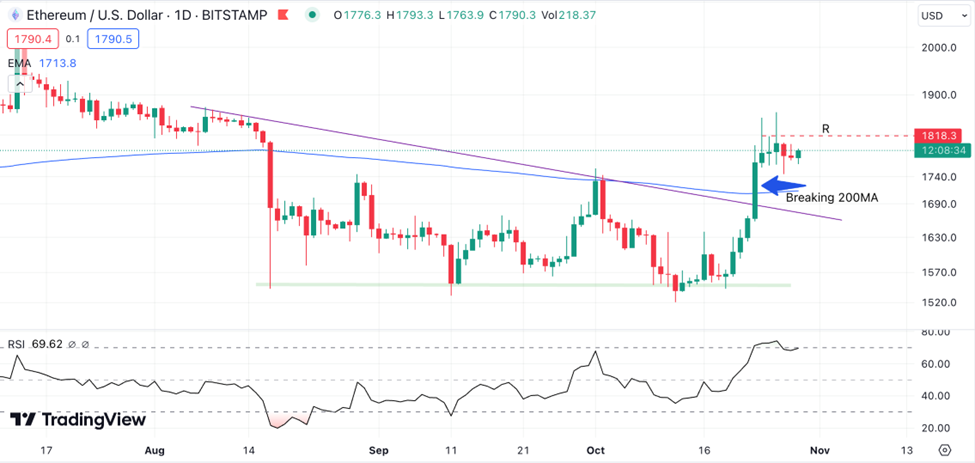
ETH, like BTC, was in a downtrend for a long time, trading at around the $1550 zone. A bearish trend line is clearly visible where the price touched it twice before breaking above it. Price before breaking the bearish channel was trading below the 200EMA and the trend line.
Later, the price broke above the trend line, and the EMA showed bullish sentiment. The most recent swing high is at $1865.0. The market has also formed a higher low and is now moving up, trying to break the previously formed swing high. Investors are to wait until the recent resistance at around $1818.3 is breached.
Based on the price fluctuations of Ethereum at the beginning of 2023, crypto experts expect an average ETH rate of $$1,843.19 in October 2023. Its minimum and maximum prices can be expected at $$1,796.78 and at $$1,889.60, respectively. The Potential ROI would be 5.6%.
Support
Resistance
S1
1806.91
R1
1818.89
S2
1801.18
R2
1825.14
S3
1794.93
R3
1823.5
XRP: XRP price increased by 1.68% and 6.64% over 24 hours and the past seven days. The asset reached a low and high of $0.5422 and $0.558, respectively.
Ripple CEO Brad Garlinghouse has publicly taken issue with former SEC Chair Jay Clayton’s recent remarks regarding the agency’s regulatory approach. Clayton’s statements, made in June 2023, have come under scrutiny due to ongoing legal developments in the lawsuit involving Garlinghouse and Chris Larsen.
Garlinghouse has criticized the SEC’s approach, pointing out that Jay Clayton brought the case against Ripple, himself, and Larsen but swiftly exited the SEC the following day. This exchange underscores the ongoing tension and legal battles between Ripple and the SEC.
XRP Technical Analysis:
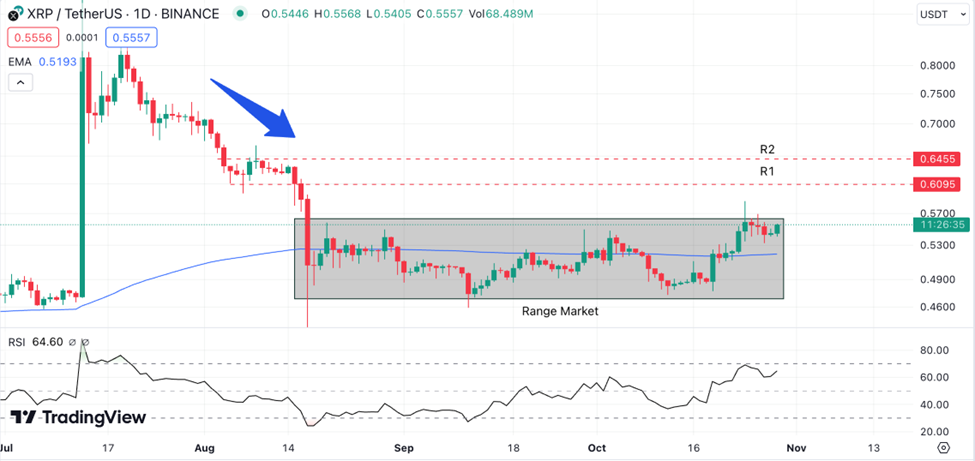
XRP is in a consolation state, stuck between two zones, $0.4681 and $0.5627. Even the 200EMA is between the range zone. As the whole crypto market is rising, the price has crossed the EMA and is moving up.
The market is very close to the resistance of $0.5627. Traders may move to the lower time frame and look for an uptrend pattern once it breaks above the region. The RSI level is at 64.60.
Based on the price fluctuations of XRP at the beginning of 2023, we expect an average XRP rate of $0.614 in October 2023. Its minimum and maximum prices can be expected at $0.557 and at $0.670, respectively. The Potential ROI would be 19.6%.
Support
Resistance
S1
0.57496
R1
0.57966
S2
0.57273
R2
0.58213
S3
0.57026
R3
0.58436
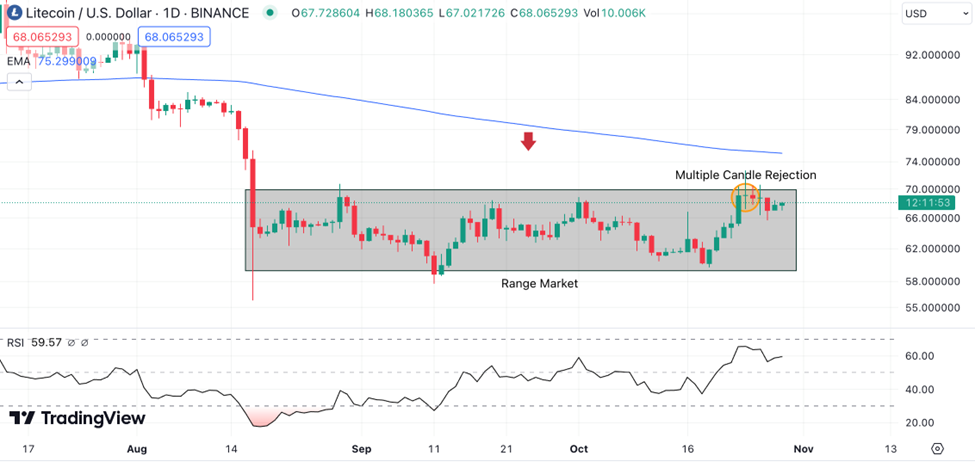
LTC: LTC price increased by 0.81% and 4.94% over 24 hours and the past seven days. The asset reached a low and high of $67.27 and $68.96, respectively.
Litecoin (LTC) stands firm amid recent market fluctuations, experiencing only a 1.35% drop, while enthusiasts take solace in the promising increase in on-chain activities. This includes a remarkable 319,000 daily active addresses and 7,418 whale transactions, reflecting robust community engagement and heightened investor interest, offering an optimistic outlook for the future of the Layer-1 protocol.
LTC Technical Analysis
LTC, just like XRP, shows a ranging sentiment, with both buyers and sellers fighting to break up or below the range. The 200EMA is above the current price, showing a bearish sentiment. Moreover, there are multiple candle rejections from the sellers at the key resistance level, showing the sellers are still in the market.
On the Daily TF, we still need to wait for the price to break above the $69.86 for confirmation for a BUY.
On the lower time frame, movement below the immediate support at $67 could see Litecoin retest the next support area at $66. However, if declines intensify, bears might extend their gaze to $64 and the lowest support in October at $60.
Support
Resistance
S1
68.784
R1
69.474
S2
68.467
R2
69.847
S3
68.094
R3
70.164
Vantage does not represent or warrant that the material provided here is accurate, current, or complete, and therefore should not be relied upon as such. The information provided here, whether from a third party or not, is not to be considered as a recommendation; or an offer to buy or sell; or the solicitation of an offer to buy or sell any financial instruments; or to participate in any specific trading strategy. Any research provided does not have regard to the specific investment objectives, financial situation and needs of any specific person who may receive it. We advise any readers of this content to seek their own advice. Without the approval of Vantage, reproduction or redistribution of this information is not permitted.
Vantage does not represent or warrant that the material provided here is accurate, current, or complete, and therefore should not be relied upon as such. The information provided here, whether from a third party or not, is not to be considered as a recommendation; or an offer to buy or sell; or the solicitation of an offer to buy or sell any financial instruments; or to participate in any specific trading strategy. Any research provided does not have regard to the specific investment objectives, financial situation and needs of any specific person who may receive it. We advise any readers of this content to seek their own advice. Without the approval of Vantage, reproduction or redistribution of this information is not permitted.