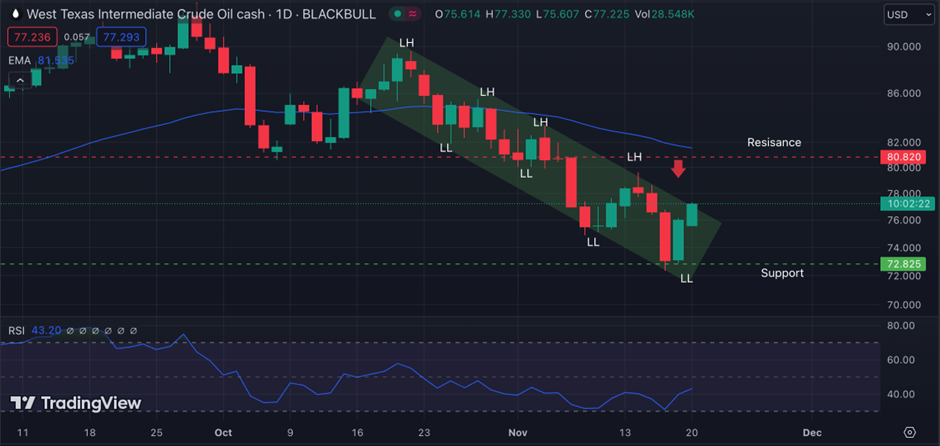
-WTI’s price is in a downtrend, trading inside a bearish channel. Trading opportunity for sellers if the price fails to break above the diagonal resistance or the swing high at $89.00
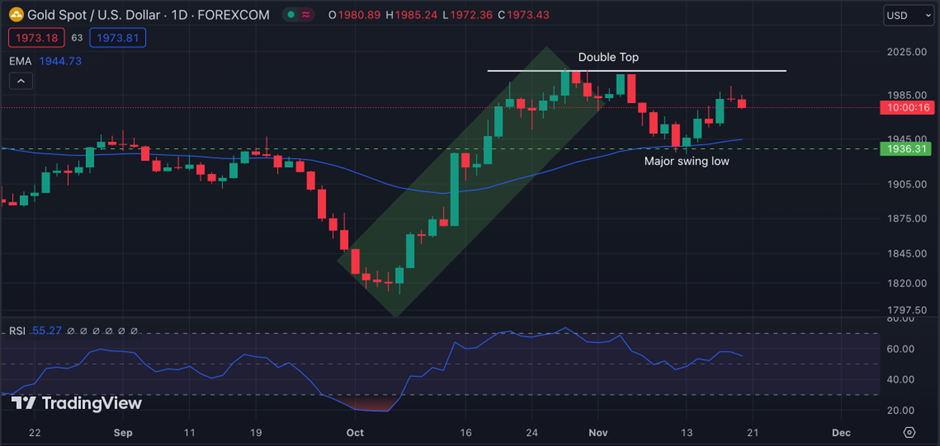
-XAUUSD chart shows a double top price action pattern formation; it shows the sell move is due.
U.S. Crude Oil Inventories
The Energy Information Administration’s (EIA) Crude Oil Inventories measures the weekly change in the number of barrels of commercial crude oil held by US firms. The level of inventories influences the price of petroleum products, which can have an impact on inflation.
If the increase in crude inventories is more than expected, it implies weaker demand and is bearish for crude prices. The same can be said if a decline in inventories is less than expected.
If the increase in crude is less than expected, it implies greater demand and is bullish for crude prices. The same can be said if a decline in inventories is more than expected.
The previous Actual data was 3.600M. The forecasted data is 1.793M. The report is due Wednesday, November 22, 2023, 21:00 GMT.
WTI Technical Analysis:
WTI is in a downtrend, with the price crossing and trading below the 50EMA. A clear lower high and lower low momentum could be seen.
A swing low formation at $72.825 where the most recent low is formed. The WTI is trading between the S&R of 72.825 and $80.820. The RSI line is at 43.20, showing natural oversold and bought condition. On the lower TF, the market condition seems perfect for a SELL call with an extra confluence. Traders may ride the wave if the price shows some rejections or reactions at the previously formed lower high of $79.00.
Pivot Points: WTI
Support
Resistance
S1
76.58
R1
77.23
S2
76.16
R2
77.46
S3
75.93
R3
77.88
U.S. Initial Jobless Claims
Initial Jobless Claims measures the number of individuals who filed for unemployment insurance for the first time during the past week. This is the earliest U.S. economic data, but the market impact varies from week to week.
A higher than expected reading should be taken as negative/bearish for the USD, while a lower than expected reading should be taken as positive/bullish for the USD.
The previous Actual data was 231K. The forecasted data is 220K. The report is due Wednesday, November 22, 2023, 19:00 GMT.
XAUUSD Technical Analysis:
In the daily time frame, XAUUSD is in a consolation state, meaning it is trading between two prices for a longer time. The 50EMA is seen moving along the price, signaling no clear market trend.
Price action shows the XAUUSD moved 10.81% from its previous major swing low at $1815.65 to a major swing high at $2006.72. The price surge was significant till the price of $2006.72, after which the price struggled to go up further; instead, a price action pattern- Double Top was formed.
After the pattern formation, the price started to come down and is currently halting at $1936.31.
The market has formed its most recent lower high with a wick reaction and a Gravestone Doji, which signifies a further down move.
Traders must wait for the successful swing low or high break for trade confirmation.
Pivot Points: XAUUSD
Support
Resistance
S1
1974.15
R1
1978.62
S2
1972.40
R2
1981.34
S3
1969.68
R3
1983.09
Vantage does not represent or warrant that the material provided here is accurate, current, or complete, and therefore should not be relied upon as such. The information provided here, whether from a third party or not, is not to be considered as a recommendation; or an offer to buy or sell; or the solicitation of an offer to buy or sell any financial instruments; or to participate in any specific trading strategy. Any research provided does not have regard to the specific investment objectives, financial situation and needs of any specific person who may receive it. We advise any readers of this content to seek their own advice. Without the approval of Vantage, reproduction or redistribution of this information is not permitted.
Vantage does not represent or warrant that the material provided here is accurate, current, or complete, and therefore should not be relied upon as such. The information provided here, whether from a third party or not, is not to be considered as a recommendation; or an offer to buy or sell; or the solicitation of an offer to buy or sell any financial instruments; or to participate in any specific trading strategy. Any research provided does not have regard to the specific investment objectives, financial situation and needs of any specific person who may receive it. We advise any readers of this content to seek their own advice. Without the approval of Vantage, reproduction or redistribution of this information is not permitted.