The worldwide crypto market is currently valued at $1.52 trillion, showing a slight increase of 2.78% in the past 24 hours. During this period, the total crypto market activity reached $48.67 billion, marking a 10.42% increase.
In the decentralized finance (DeFi) sector, the volume stands at $5.41 billion, contributing 11.11% to the overall crypto market activity within the last day. Stablecoins make up a significant portion, totaling $43.25 billion and representing 88.87% of the total crypto market volume in the past 24 hours.
As for Bitcoin, its dominance has risen to 52.43%, showing a slight increase of 0.46% during the day.
BTC: BTC price increased by 3.60% and 9.31% over 24 hours and the past seven days. The assets reached a low and high of $39,341.51 and $40,875.23, respectively.
Grayscale, a frontrunner in crypto asset management, recently hinted at transforming its Grayscale Bitcoin Trust (GBTC) into a Bitcoin ETF, a move poised to bridge the current 8.09% gap between its $1.89 billion market value and Bitcoin’s price. Such a shift holds the potential to align GBTC’s valuation more closely with the actual worth of Bitcoin, possibly erasing the discount and offering substantial advantages to investors.
This strategic transition by Grayscale to convert GBTC into a Bitcoin ETF might eliminate the existing 8.09% disparity between its market value and Bitcoin’s price, potentially aligning the trust’s value more accurately with the cryptocurrency. This move bears promising advantages and is expected to narrow the gap and benefit investors considerably.
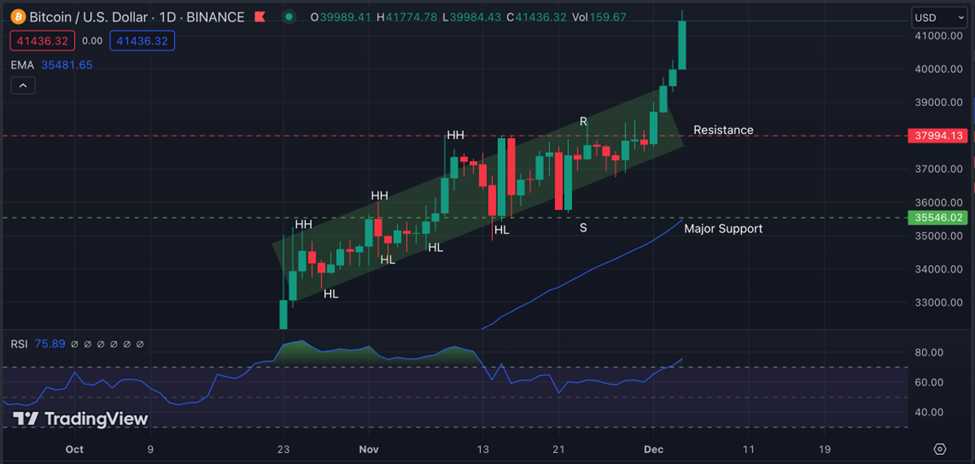
BTC Technical Analysis:
BTC maintains its bullish move and has broken the most recently formed resistance level of $37994.13.
The price also broke the bullish channel and is moving up. The 50EMA is still trading below and is far from the current price, showing a bullish sentiment. The price is forming higher highs and higher lows.
The RSI level is at 75.89, signaling an overbought condition. As discussed in the previous analysis, the price broke the previous high and surged, forming a new swing high of $41774.78.
As per our previous analysis, the $39133.49 is breached. Moreover, if that level is breached, the price may stand at near $46000.00 level.
Support
Resistance
S1
41028.4
R1
41635.4
S2
40623.7
R2
41837.7
S3
40421.4
R3
42242.4
ETH: ETH price increased by 2.40% and 8.05% over 24 hours and the past seven days. The asset reached a low and high of $2,151.72 and $2,228.01, respectively.
Former Ethereum advisor Steven Nerayoff, entangled in legal matters, reveals plans for an AI-Web3 initiative merging blockchain and artificial intelligence. He highlights Ethereum’s shortcomings and aims for a “Crypto 2.0 reboot” to restore decentralized applications and realign the industry with its founding ideals. Despite facing challenges, Nerayoff intends to establish a blockchain innovation hub, positioning himself as a pivotal figure shaping Ethereum’s future and the wider crypto domain.
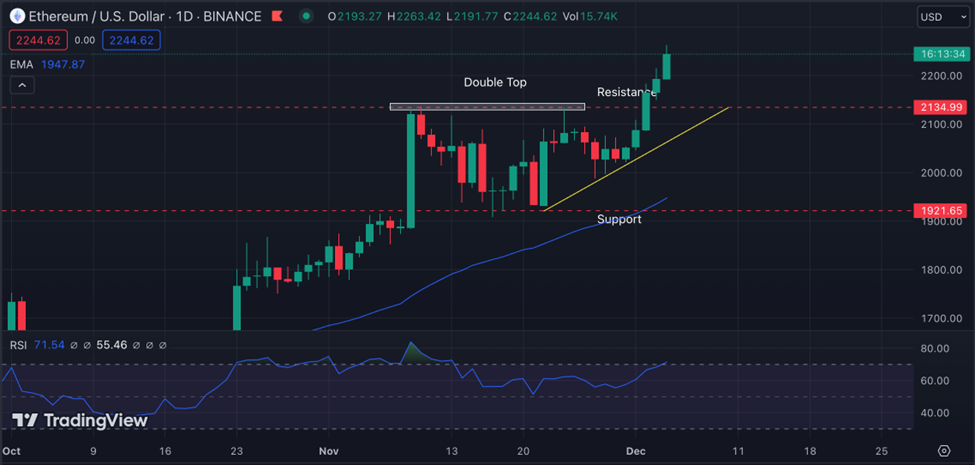
ETH Technical Analysis:
ETH was moving up and was trading between major current zones of $1921.65 and $2134.99. However, the $2134.99 is breached. The double-top pattern formed is now breached.
Just like BTC, ETH is moving in a solid upswing. Plotting the trend line, the price is following it, taking the support. The 50EMA is below the current price. The RSI is at 71.54, showing an overbought condition. The price here can come for a retest at the $2134.99 level. The new swing high is at $2263.42.
Based on the analysis, ETH is anticipated to reach $$2400.00 by mid-December 2023.
Support
Resistance
S1
2226.92
R1
2257.38
S2
2208.85
R2
2269.77
S3
2196.46
R3
2287.84
XRP: XRP price increased by 1.58% and 3.11% over 24 hours and the past seven days. The asset reached a low and high of $0.6181 and $0.6309, respectively.
XRP attorneys, led by John E. Deaton, directed a crucial plea aimed explicitly at Republican House Financial Services Committee members, particularly Chairman Patrick McHenry. This call urged the Committee to actively oversee the SEC and its Chairman, Gary Gensler, stressing the necessity of a congressional subpoena. Deaton emphasized concerns over what he perceives as the SEC and Gary Gensler’s disregard for legal adherence, asserting their perceived threat to the cryptocurrency industry. He urged Chairman Patrick McHenry and the Financial Services Committee to take robust and immediate action. Furthermore, Attorney Bill Morgan expressed surprise at the Committee’s hesitancy in issuing a congressional subpoena, hinting at potential political motives underlying their stance.
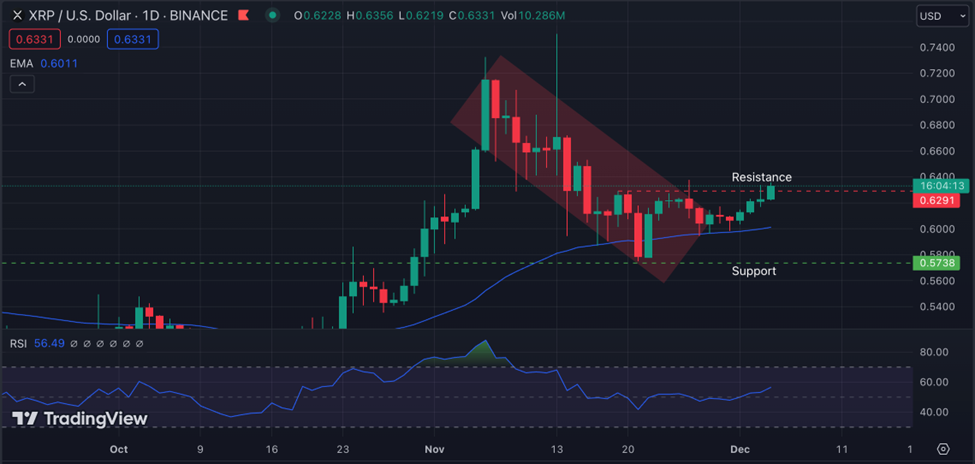
XRP Technical Analysis:
XRP was in a downtrend but is now stuck between two zones, $0.4681 and $0.5627. In the previous analysis, we plotted a resistance that the price is trying to break. The price is taking support of the 50EMA, which is a good sign of a bullish move.
As the whole crypto market rises, we could see XRP enthusiasts and investors getting into the market. The RSI line is at 56.49, a signal of slight overbought condition. The price is now breaking the previous swing high and the resistance.
XRP may trade at $0.8498 very soon if the market continues to move in the bullish direction.
Support
Resistance
S1
0.6296
R1
0.6344
S2
0.6266
R2
0.6362
S3
0.6248
R3
0.6392
LTC: LTC price increased by 2.74% and 6.48% over 24 hours and the past seven days. The asset reached a low and high of $71.45 and $74.46, respectively.
LTC stock saw a 10% dip, halting its climb and stabilizing at $55.85. Poor performance redirected investor attention. Trader John Bollinger warned about LTC, noting its lag compared to Bitcoin. LTC’s correlation with BTC could predict market trends, indicating lower trader confidence or interest. A 14% volume drop in LTC trades signals a struggle, urging caution for investors eyeing the altcoin.
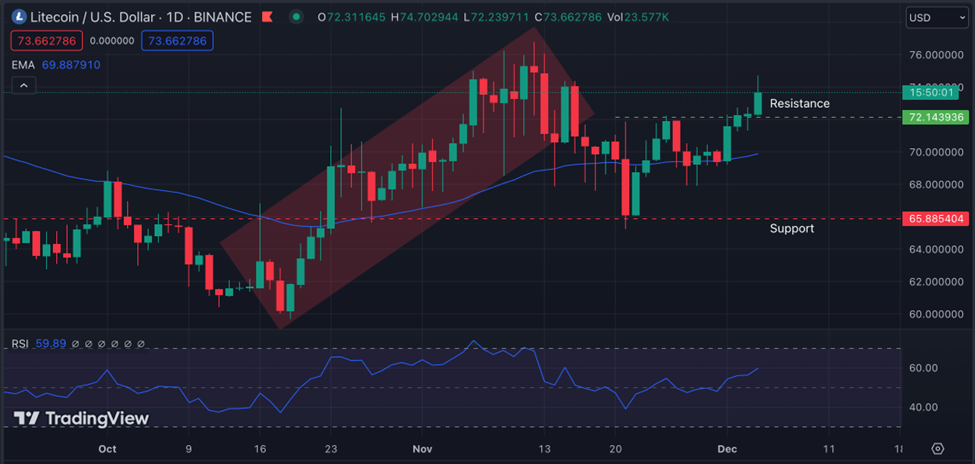
LTC Technical Analysis:
LTC was moving up but then went into a ranging condition. LTC price broke the range, moving up. On the way, it also took the support of the 50EMA. The current price has started trading above the 50EMA by crossing above it, showing a bullish sentiment.
The price broke the resistance that we plotted previously. The RSI line is at 64.18, showing a slight overbought condition. The market is forming a higher high and higher low, with multiple wick rejections from the buyers showing a bullish inclination. The next major resistance is at $76, which the market may break if it continues its bullish move.
LTC is predicted to reach $80 in Dec.
Support
Resistance
S1
73.746
R1
74.286
S2
73.503
R2
74.583
S3
73.206
R3
74.826
Vantage does not represent or warrant that the material provided here is accurate, current, or complete, and therefore should not be relied upon as such. The information provided here, whether from a third party or not, is not to be considered as a recommendation; or an offer to buy or sell; or the solicitation of an offer to buy or sell any financial instruments; or to participate in any specific trading strategy. Any research provided does not have regard to the specific investment objectives, financial situation and needs of any specific person who may receive it. We advise any readers of this content to seek their own advice. Without the approval of Vantage, reproduction or redistribution of this information is not permitted.
Vantage does not represent or warrant that the material provided here is accurate, current, or complete, and therefore should not be relied upon as such. The information provided here, whether from a third party or not, is not to be considered as a recommendation; or an offer to buy or sell; or the solicitation of an offer to buy or sell any financial instruments; or to participate in any specific trading strategy. Any research provided does not have regard to the specific investment objectives, financial situation and needs of any specific person who may receive it. We advise any readers of this content to seek their own advice. Without the approval of Vantage, reproduction or redistribution of this information is not permitted.