The worldwide crypto market is currently valued at $1.55 trillion, showing a slight decrease of 1.87% in the past 24 hours. During this period, the total crypto market activity reached $62.6 billion, marking a 32.73% increase. In the decentralized finance (DeFi) sector, the volume stands at $7.55 billion, contributing 12.60% to the overall crypto market activity within the last day. Stablecoins make up a significant portion, totalling $56.43 billion and representing 90.14% of the total crypto market volume in the past 24 hours.
As for Bitcoin, its dominance has risen to 52.08%, showing a slight increase of 0.52% during the day.
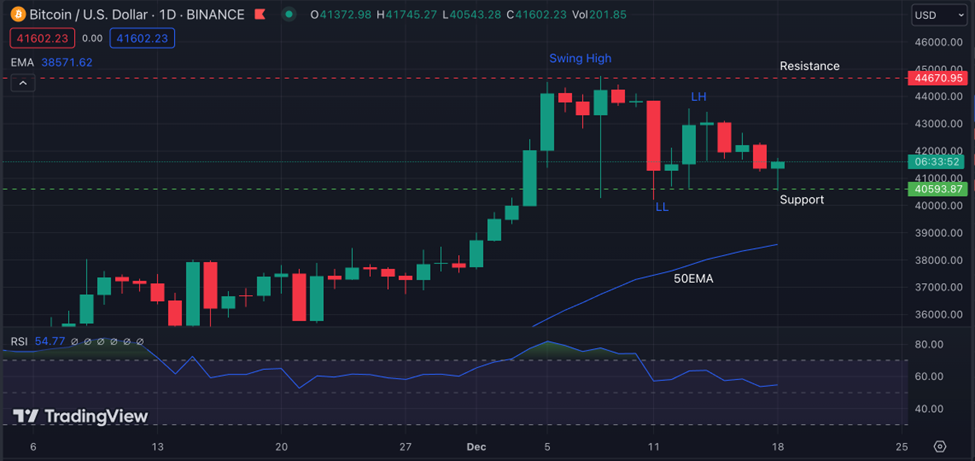
BTC: BTC price decreased by 1.09% and 0.68% over 24 hours and the past seven days. The asset reached a low and high of $40,530.26 and $42,359.50, respectively.
Jan van Eck, CEO of VanEck, foresees Bitcoin soaring to new highs next year. His optimism stems from Bitcoin’s upcoming halving event and expanding user base. Drawing from his traditional asset management background, van Eck likens Bitcoin’s growth and endurance since 2017 to that of gold, emphasizing its emergence as a resilient store of value.
Van Eck’s bullish stance on Bitcoin aligns with its history in gold-related investments, highlighting the parallels between Bitcoin’s trajectory and the established role of gold as a store of value despite initial skepticism and challenges.
BTC Technical Analysis:
BTC has maintained its bullish momentum and is trading between S&R $40593.87 and $44670.95.
The EMA is below the current price, signaling bullish pressure. The price formed higher highs and higher lows until the swing high at $44670.95, after which the market had a pullback till $40593.87. Currently, the price is forming a lower high and lower low pattern.
The RSI level is at 54.77, signaling a neutral overbought and oversold condition. However, no signal suggests the price would come down except for the formation of a price pattern. Based on our analysis, Bitcoin may go up to $460000, which is also a physiological level in the coming weeks.
Support
Resistance
S1
41331.4
R1
41561.4
S2
41254.7
R2
41714.7
S3
41101.4
R3
41791.5
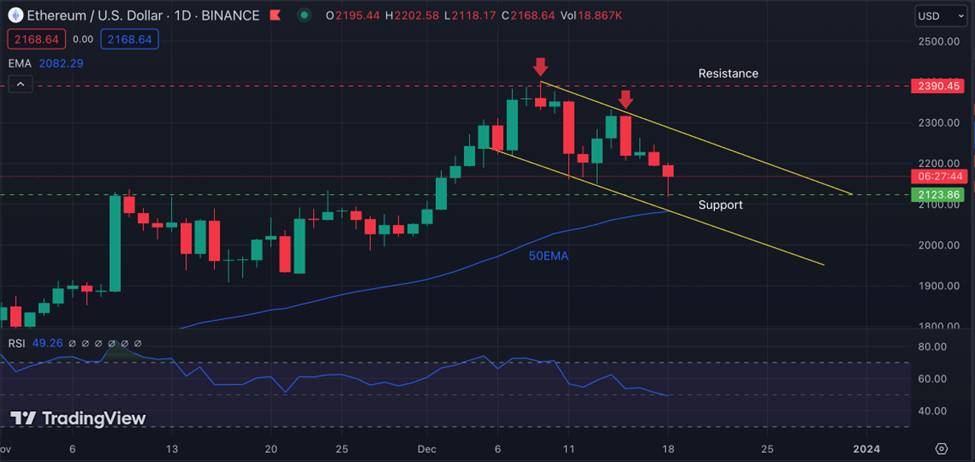
ETH: ETH price decreased by 3.00% and 2.14% over 24 hours and the past seven days. The asset reached a low and high of $2,120.13 and $2,244.37, respectively.
ENS (Ethereum Name Service) attained complete decentralization, confirmed by founder Nick Johnson on X. A unanimous vote shifted ENS root key ownership to the ENS DAO, led by figures like Sergey Nazarov, Dan Finlay, Taylor Monahan, Aron Fischer, Jason Carver, and Martin Swende. The DAO now controls protocol keys and manages top-level domains, excluding the unchangeable “.eth” TLD.
ETH Technical Analysis:
ETH could be seen sliding down a bit after forming its swing high at $2390.45. Traders and investors will still be buy-biased as the overall market seems to have a bullish sentiment. The market is moving up, breaking the double-top pattern formed previously.
The price is currently inside the bearish channel, where it touched the diagonal resistance twice.
The 50 EMA is below the price, and the RSI line is at 49.26, showing a neutral overvalued condition. Traders must wait for the break of the previous swing low and also the support at $2123.86 for it to be a valid sell confirmation.
ETH might reach $2500 by the end of this year 2023.
Support
Resistance
S1
2158.62
R1
2169.47
S2
2154.06
R2
2175.76
S3
2147.77
R3
2180.32
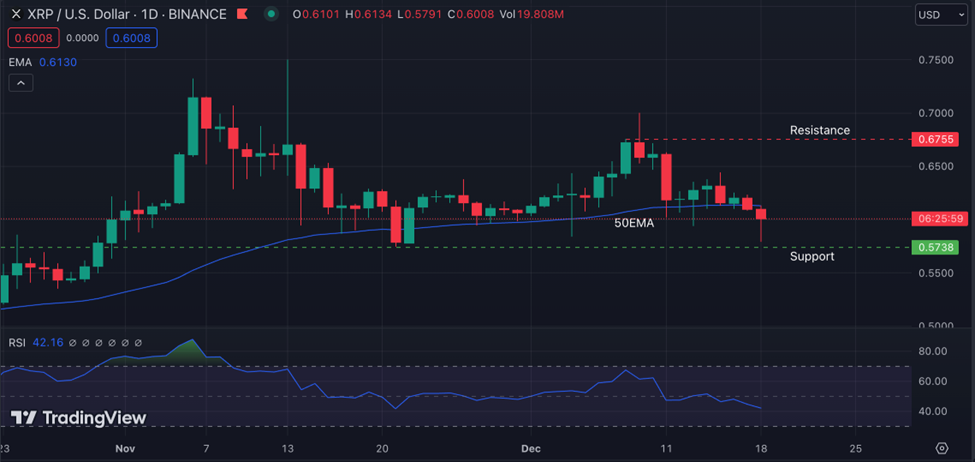
XRP: XRP price decreased by 3.40% and 3.28% over 24 hours and the past seven days. The asset reached a low and high of $0.5834 and $0.6215, respectively.
In an interview with crypto analyst Zach Rector, Patrick L. Riley of Reaper Ascencion Index Ark Institute forecasted a potential new peak for XRP in the upcoming bull market. Riley believes XRP could surge past $22, citing robust XRP Ledger development and increasing adoption. He highlighted EVM side chains’ addition, anticipating a shift from ERC20 projects to XRP for its speed and cost advantages.
XRP Technical Analysis:
XRP, like other major currencies, is losing its price. The price started to slide down from a major swing high at $0.7004. The 50EMA is with the current price below, signaling no clear price movement or trend. The RSI line is at 42.16, which is again slightly down and a signal of an oversold condition.
In the current scenario, we cannot confirm any trading opportunity because the price is making small candles with wick rejection. Traders to wait until the previous swing high or low is breached.
XRP may trade at $0.8498 very soon if the market continues to move in the bullish direction.
Support
Resistance
S1
0.59784
R1
0.60114
S2
0.59617
R2
0.60277
S3
0.59454
R3
0.60444
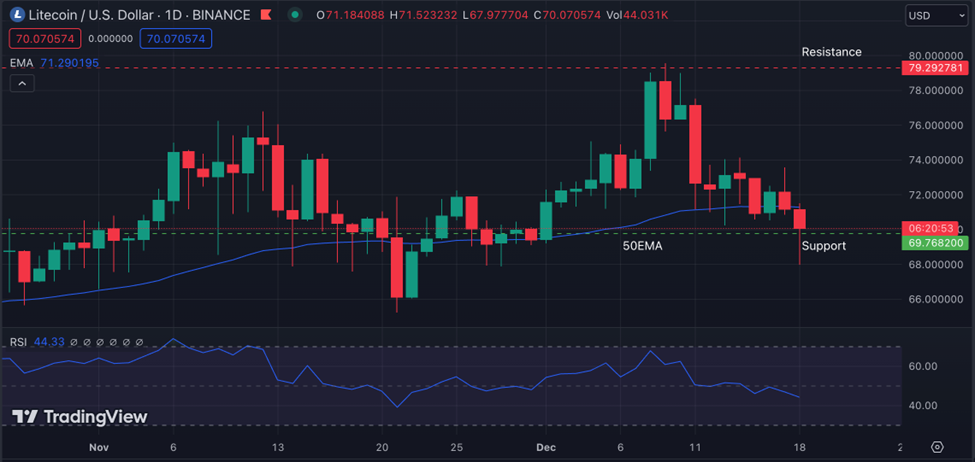
LTC: LTC price decreased by 4.38% and 4.47% over 24 hours and the past seven days. The asset reached a low and high of $68.38 and $73.22, respectively.
Litecoin (LTC), a major PoW chain, hit an all-time high mining difficulty of 30.03M, with a recent 6% surge in 24 hours and a 16% spike in a week. Mining difficulty adjusts to maintain a 2.5-minute block generation time. A recent hash rate surge to 872 TH/s prompted this increase, balancing heightened mining capability. Higher difficulty ensures network security, thwarting manipulation. Rising miner numbers signal LTC’s growth potential, a positive sign for its future.
LTC Technical Analysis:
LTC was moving up but previously had shown ranging conditions. LTC price broke the range, moving up. The 50EMA breached the price, moving down. $79.559 is the recent swing high and a resistance to the current price.
The $69.768 zone is a strong support for the current price. A long-wick rejection from the buyers shows the buyers are still in the market. The RSI line is at 44.33, showing a slightly oversold condition.
LTC is predicted to range between $80 to $82 in December.
Support
Resistance
S1
69.764
R1
70.214
S1
69.547
R1
70.447
S1
69.314
R1
70.664
Vantage does not represent or warrant that the material provided here is accurate, current, or complete, and therefore should not be relied upon as such. The information provided here, whether from a third party or not, is not to be considered as a recommendation; or an offer to buy or sell; or the solicitation of an offer to buy or sell any financial instruments; or to participate in any specific trading strategy. Any research provided does not have regard to the specific investment objectives, financial situation and needs of any specific person who may receive it. We advise any readers of this content to seek their own advice. Without the approval of Vantage, reproduction or redistribution of this information is not permitted.
Vantage does not represent or warrant that the material provided here is accurate, current, or complete, and therefore should not be relied upon as such. The information provided here, whether from a third party or not, is not to be considered as a recommendation; or an offer to buy or sell; or the solicitation of an offer to buy or sell any financial instruments; or to participate in any specific trading strategy. Any research provided does not have regard to the specific investment objectives, financial situation and needs of any specific person who may receive it. We advise any readers of this content to seek their own advice. Without the approval of Vantage, reproduction or redistribution of this information is not permitted.