Initial Jobless Claims measures the number of individuals who filed for unemployment insurance for the first time during the past week. This is the earliest U.S. economic data, but the market impact varies from week to week.
A higher than expected reading should be taken as negative/bearish for the USD, while a lower than expected reading should be taken as positive/bullish for the USD.
The previous Actual data was 205K. The forecasted data is 214K. The report is due Thursday, December 28, 2023, 19:00 GMT.
EURUSD Technical Analysis:
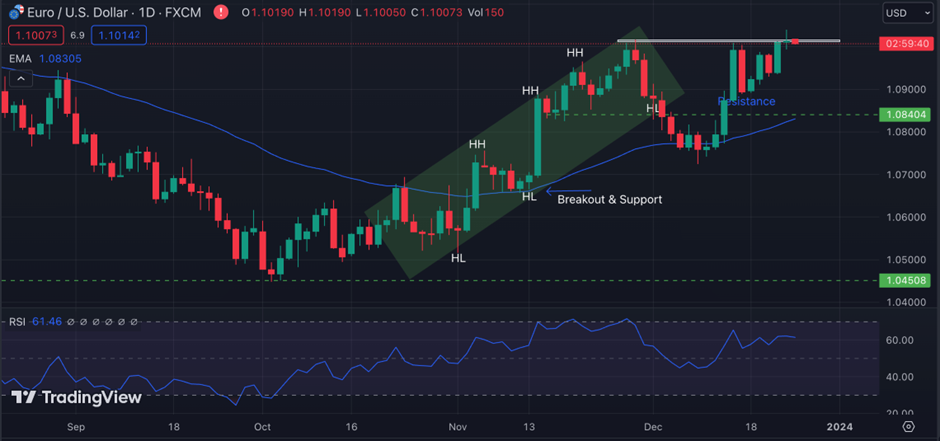
EURUSD recently had a significant up move after a long bearish sentiment. The price went up the previous week and came down with a high volume and volatility. The 50EMA is below the price, which still shows a bullish market. Overall, the price is still maintaining its bullish momentum.
The RSI line is at 61.48, which shows an overbought condition. The price currently trades between two major levels of $1.08404 and $1.10095. We can now see a reversal price pattern formation- Double Top. The price previously broke the bullish channel and went through a significant pullback till $1.07543.
If the price now breaks above the major resistance at $1.10095 and forms a break and retest pattern holding for a while, it may continue its uptrend further. However, if the price breaks below the recent support at $1.08404, the price may go for a new swing low. Traders may go on the lower time frame for trade confirmation.
Pivot Points: EURUSD
Support
Resistance
S1
1.1011
R1
1.1016
S2
1.1008
R2
1.1018
S3
1.1006
R3
1.1021
U.S. Crude Oil Inventories
The Energy Information Administration’s (EIA) Crude Oil Inventories measures the weekly change in the number of barrels of commercial crude oil held by US firms. The level of inventories influences the price of petroleum products, which can have an impact on inflation.
If the increase in crude inventories is more than expected, it implies weaker demand and is bearish for crude prices. The same can be said if a decline in inventories is less than expected.
If the increase in crude is less than expected, it implies greater demand and is bullish for crude prices. The same can be said if a decline in inventories is more than expected.
The previous Actual data was 2.909M. The forecasted data is -2.283M. The report is due Thursday, December 28, 2023, 21:30 GMT.
WTI Technical Analysis:
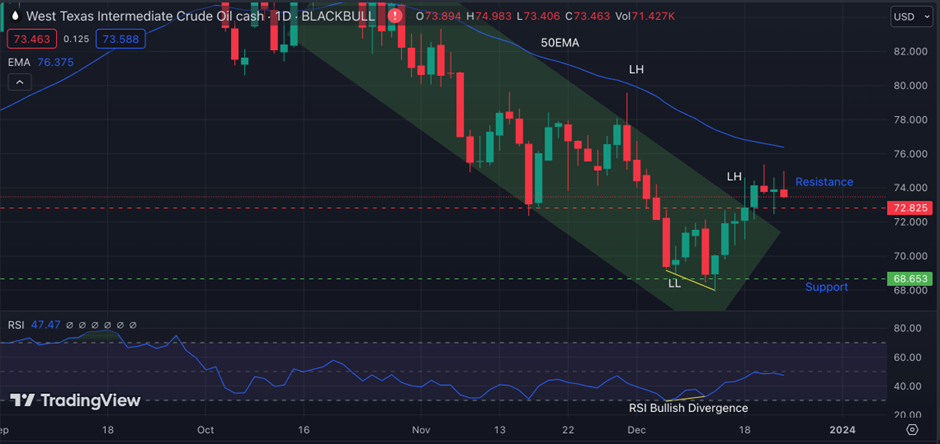
WTI is in a downtrend, trading inside a bearish channel, forming lower highs and lows. The 50EMA is trading above the price, validating the downtrend.
The RSI Bullish Divergence could be seen, signaling the price may reverse from the current point.
The market was trading between two regions, $68.653 and $72.825, which the price broke above recently.
Multiple candles with wick rejection could been right above the recent resistance zone. The price also broke the bearish channel and formed its lower high, which may be a false breakout, and the price may come down for its lower low. However, looking at the circumstances, the price may reverse from this price point.
Pivot Points: WTI
Support
Resistance
S1
73.49
R1
73.72
S2
73.38
R2
73.84
S3
73.26
R3
73.95
Vantage does not represent or warrant that the material provided here is accurate, current, or complete, and therefore should not be relied upon as such. The information provided here, whether from a third party or not, is not to be considered as a recommendation; or an offer to buy or sell; or the solicitation of an offer to buy or sell any financial instruments; or to participate in any specific trading strategy. Any research provided does not have regard to the specific investment objectives, financial situation and needs of any specific person who may receive it. We advise any readers of this content to seek their own advice. Without the approval of Vantage, reproduction or redistribution of this information is not permitted.
Vantage does not represent or warrant that the material provided here is accurate, current, or complete, and therefore should not be relied upon as such. The information provided here, whether from a third party or not, is not to be considered as a recommendation; or an offer to buy or sell; or the solicitation of an offer to buy or sell any financial instruments; or to participate in any specific trading strategy. Any research provided does not have regard to the specific investment objectives, financial situation and needs of any specific person who may receive it. We advise any readers of this content to seek their own advice. Without the approval of Vantage, reproduction or redistribution of this information is not permitted.