The worldwide crypto market is currently valued at $1.67 trillion, showing a slight increase of 0.54% in the past 24 hours. During this period, the total crypto market activity reached $68.45 billion, marking a 52.47% increase. In the decentralized finance (DeFi) sector, the volume stands at $6.94 billion, contributing 10.14% to the overall crypto market activity within the last day. Stablecoins make up a significant portion, totalling $58.04 billion and representing 84.79% of the total crypto market volume in the past 24 hours.
As for Bitcoin, its dominance has risen to 52.80%, showing a slight increase of 0.51% during the day.
BTC: BTC price increased by 1.44% and 5.65% over 24 hours and the past seven days. The asset reached a low and high of $43,244.08 and $45,207.45, respectively.
Approaching the January 2024 deadline, the United States Securities and Exchange Commission (SEC) is in the final stages of deliberating on multiple spot Bitcoin ETF (Exchange-Traded Funds) applications. If these applications were sanctioned, investors would gain access to Bitcoin investments without grappling with the complexities of purchasing and safeguarding cryptocurrency. This impending milestone holds the promise of significantly bolstering Bitcoin’s status as an investment asset.
Long-awaited across the cryptocurrency landscape, the approval of Bitcoin ETFs has been an ongoing anticipation, given the SEC’s track record of rejecting prior applications. However, the recent nod from the SEC for a Bitcoin futures ETF has ignited optimism regarding the potential approval of spot Bitcoin ETFs shortly. Should these ETFs receive the SEC’s approval, they could attract a broader spectrum of investors to Bitcoin, potentially triggering increased adoption and contributing to price stability.
BTC Technical Analysis:
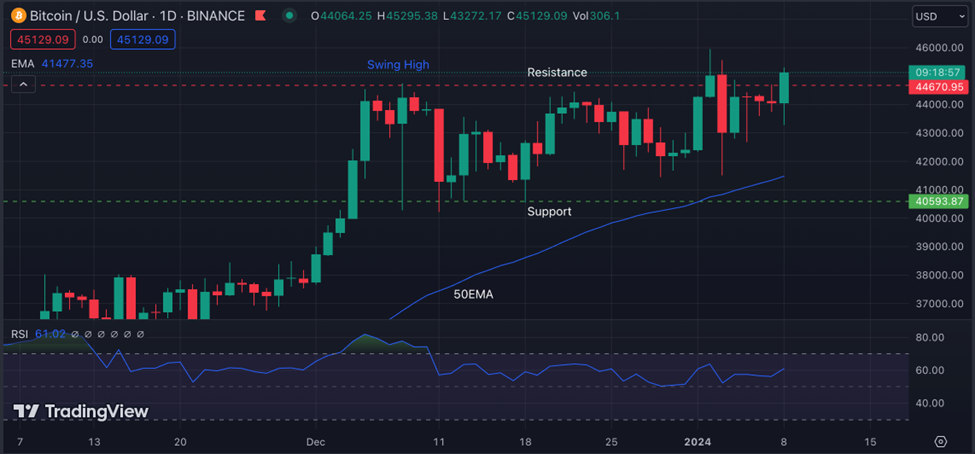
BTC was trading between S&R $40593.87 and $44670.95 till the previous week. We could see the price lifting up, forming at least higher highs, but the resistance at $44670.95 was hard for the buyers to break. However, this week, we saw the price surge where the buyers broke the resistance.
Like the previous week, the EMA is still trading below the current price. The RSI level is at 61.02, signalling a slightly overbought condition. The chart shows the price breaking the previous swing high and a major resistance zone. The overall trend is bullish.
As trading under buyers’ influence, Bitcoin will break above the $46000 level.
Support
Resistance
S1
44797.2
R1
45085.6
S2
44676.4
R2
45253.2
S3
44508.8
R3
45374
ETH: ETH price increased by 0.75% and decreased by 1.65% over 24 hours and the past seven days. The asset reached a low and high of $2,171.99 and $2,276.58, respectively.
Ethereum has undergone a significant overhaul known as the Merge, which has moved the digital machinery at the core of the second-largest cryptocurrency by market value to a vastly more energy-efficient system after years of development and delay. This is a significant milestone for Ethereum and the cryptocurrency industry as a whole. The transition to proof-of-stake is expected to reduce Ethereum’s energy consumption by over 99%.
ETH Technical Analysis:
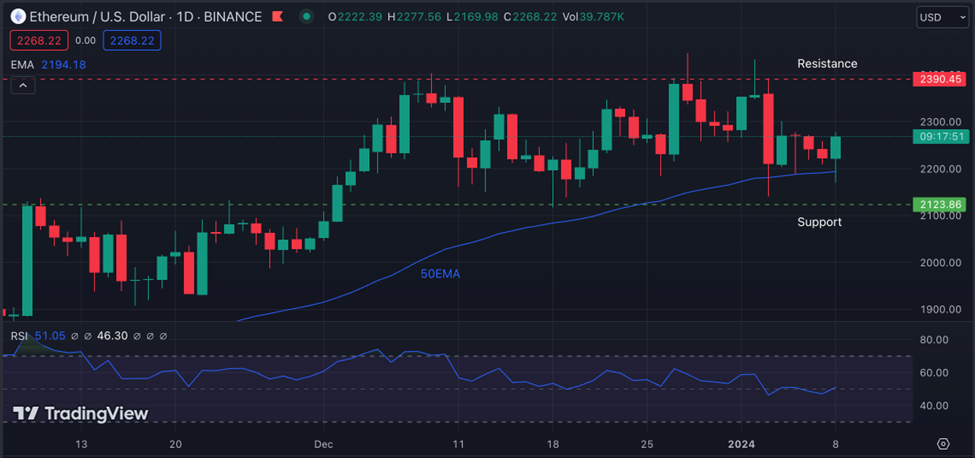
The level of $2390.45 is a strong resistance, continuously pushing the price down. The price touched the level thrice and went down. However, the $2123.86 level is also a strong support.
The 50EMA is below the current price but is very close to the price, showing the price may trade in a consolidation state soon. The RSI line is at 51.05, showing neutral overbought and oversold conditions. There is no clear trade opportunity in ETH as the price is stuck between $2123.86 and $2390.46.
ETH might reach $2500 by the end of Jan 2024.
Support
Resistance
S1
2258.95
R1
2273.86
S2
2252.02
R2
2281.84
S3
2244.04
R3
2288.77
XRP: XRP price decreased by 0.97% and 8.92% over 24 hours and the past seven days. The asset reached a low and high of $0.5485 and $0.5785, respectively.
XRP’s market value rapidly surged over $300 million as the crypto market opened on Sunday. This coincided with a 1% increase in XRP’s value, propelling it to $0.573 per token and boosting the token’s market capitalization to surpass $31 billion. However, this surge was short-lived as the market took a downturn, leading to a subsequent decrease of $300 million in XRP’s capitalization. Presently positioned as the sixth-largest cryptocurrency, XRP sits between USDC and Solana (SOL) in the market rankings.
XRP Technical Analysis:
XRP is losing its strength, and the price is sliding down. A lot of small candles with wick rejection shows there is no clear sentiment. On the 3rd of January, a significant move decreased the price by 19.18%. However, the buyers pushed the price up again.
The 50EMA crosses the current price, moving down and showing bearish pressure. Traders and Investors look for a break of $0.5358 or $0.5738, which is also the current support or resistance.
The RSI line is 36.99, a neutral overbought or oversold condition signal. XRP may trade at $0.8498 very soon if the market reverses.
Support
Resistance
S1
0.5618
R1
0.566
S2
0.5602
R2
0.5686
S3
0.5576
R3
0.5702
LTC: LTC price increased by 0.30% and decreased by 10.47% over 24 hours and the past seven days. The asset reached a low and high of $61.71 and $65.76, respectively.
Based on insights from BitPay, Litecoin (LTC) experienced a noteworthy surge in its global payment share, climbing from 34.52% in November to a record high of 38.25% in December. This marked an all-time peak for Litecoin’s market presence and revealed a substantial portion of the market share gained from Bitcoin. LTC emerged as a preferred choice for purchasing goods and services, surpassing the combined usage of BTC and Ethereum (ETH). Glassnode data showcased a remarkable surge in LTC transactions in December, setting new records.
LTC Technical Analysis:
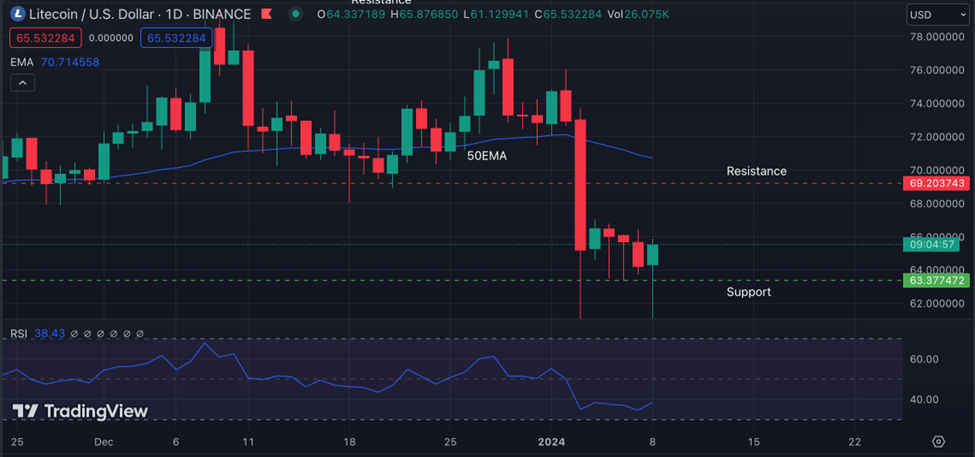
LTC is moving down, with many bearish candles pushing the price down. The 50EMA crossed the price, moving down, which is above the current price.
The market is forming lower highs and lower lows. Wick rejections from the buyers could be seen on the chart. The RSI line is at 38.43, showing neutral overbought and oversold conditions. We could very soon see the price increase as a surge in major currencies.
LTC is predicted to reach $80 in Jan 2024.
Support
Resistance
S1
65.136
R1
65.636
S2
64.883
R2
65.883
S3
64.636
R3
66.136
Vantage does not represent or warrant that the material provided here is accurate, current, or complete, and therefore should not be relied upon as such. The information provided here, whether from a third party or not, is not to be considered as a recommendation; or an offer to buy or sell; or the solicitation of an offer to buy or sell any financial instruments; or to participate in any specific trading strategy. Any research provided does not have regard to the specific investment objectives, financial situation and needs of any specific person who may receive it. We advise any readers of this content to seek their own advice. Without the approval of Vantage, reproduction or redistribution of this information is not permitted.
Vantage does not represent or warrant that the material provided here is accurate, current, or complete, and therefore should not be relied upon as such. The information provided here, whether from a third party or not, is not to be considered as a recommendation; or an offer to buy or sell; or the solicitation of an offer to buy or sell any financial instruments; or to participate in any specific trading strategy. Any research provided does not have regard to the specific investment objectives, financial situation and needs of any specific person who may receive it. We advise any readers of this content to seek their own advice. Without the approval of Vantage, reproduction or redistribution of this information is not permitted.