The worldwide crypto market is currently valued at $1.98 trillion, showing a slight increase of 1.59% in the past 24 hours. During this period, the total crypto market activity reached $57.86 billion, marking a 10.86% increase. In the decentralized finance (DeFi) sector, the volume stands at $6.14 billion, contributing 10.61% to the overall crypto market activity within the last day. Stablecoins make up a significant portion, totalling $51.34 billion and representing 88.74% of the total crypto market volume in the past 24 hours.
As for Bitcoin, its dominance has risen to 51.82%, showing a slight decrease of 0.29% during the day.
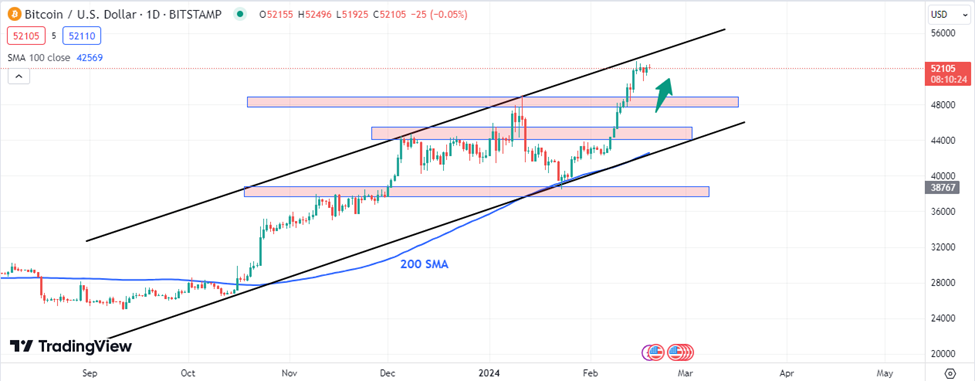
BTC: BTC price increased by 1.09% and 9.34% over 24 hours and the past seven days.The asset reached a low and high of $51,567.39 and $52,483.33, respectively.
Bitcoin saw significant activity today on Coinbase, with a whopping $962.15 million withdrawn. Whale Alert data reveals 18,484.69 BTC leaving Coinbase in two consecutive transfers. The first transfer moved 9,322 BTC (valued at $485.248 million) to the address “1AyhP.” Subsequently, 9,162 BTC (worth $476.9 million) went to the address “19hJg.”
Notably, both addresses are newly established. Despite this withdrawal, Bitcoin’s price rose incrementally, reaching $52,400 with a market cap above $1 trillion. The implications of these movements remain uncertain, but the crypto community closely watches for potential signals.
BTC Technical Analysis:
The daily chart shows the Bitcoin price hovering around $52k mark. This is a clear indication of the optimism amongst the investors as they are looking forward to Bitcoin creating new milestones in the year ahead.
Yet, in the natural ebb and flow of market dynamics, corrective phases are essential after strong upward trends. Such a phase is anticipated for Bitcoin shortly for the market to stabilize and gather strength.
Conversely, if Bitcoin (BTC) successfully breaks this level, then we could see it climb with few obstacles until it reaches the $59k to $60k resistance zone. While a short term correction may be possible, the overall sentiment favors a further hike of the Bitcoin price in the coming weeks.
Support
Resistance
S1
51334
R1
52618
S2
50607
R2
53175
S3
50050
R3
53902
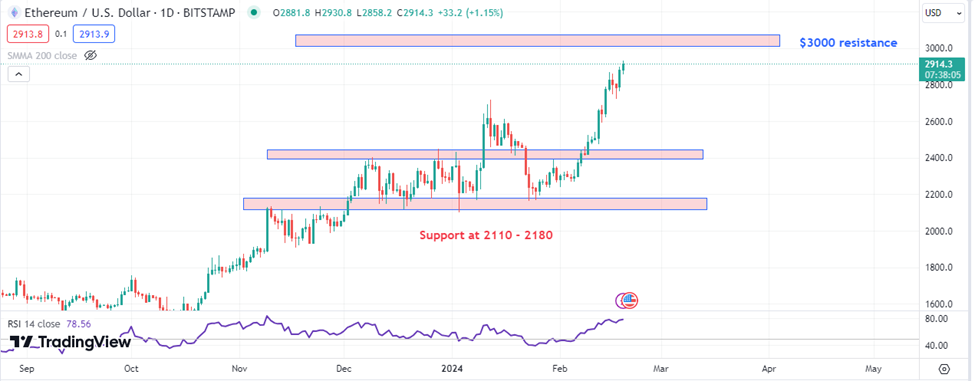
ETH: ETH price increased by 3.58% and 17.23% over 24 hours and the past seven days. The asset reached a low and high of $2,788.26 and $2,917.11, respectively.
The financial research firm Bernstein predicts a surge in institutional investments in Ethereum, the second-largest cryptocurrency. Following Bitcoin’s value surge due to Bitcoin-focused exchange-traded funds (ETFs), Bernstein believes Ethereum could soon gain similar attention. The likelihood of a spot Ethereum ETF approval by the SEC is strong, with a 50% chance by May and near certainty within a year. Major players like Franklin Templeton, Blackrock, and Fidelity are actively exploring this opportunity, signaling positive prospects for Ethereum.
ETH Technical Analysis:
Ethereum demonstrated an outstanding performance previous week, which has left its price 14% higher. This development has boosted Ethereum to a new high for the year at $2,868 and made it the top performer spot. The cryptocurrency is now well prepared to reach the $3,000 resistance level.
The price has been supported at $2,110 – $2,180 and a strong rebound was observed after a successful retest of this level. The Relative Strength Index (RSI) on 1-day chart has reached 77-78, which means that Ethereum is possibly overbought at the moment. It implies a small step back in the short-term.
For the future outlook, Ethereum is in a very good position to break the significant resistance at $3,000. The milestone can, however, trigger price selling by sellers which in turn might influence the price direction.
Support
Resistance
S1
2799.79
R1
2926.61
S2
2719.47
R2
2973.11
S3
2672.97
R3
3053.43
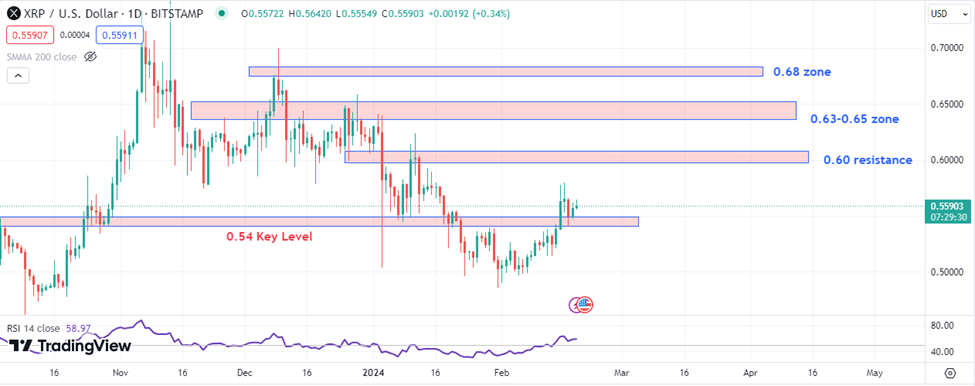
XRP: XRP price increased by 0.24% and 8.34% over 24 hours and the past seven days. The asset reached a low and high of $0.5541 and $0.5637, respectively.
Ripple’s CTO, David Schwartz, firmly defended the company against allegations of XRP dumping. He stressed their commitment to transparency in XRP sales. Despite the ongoing debate, Ripple remains committed to maintaining transparency in its XRP sales. The company’s efforts to address concerns and engage with the XRP community demonstrate its dedication to responsible practices. As the cryptocurrency landscape continues to evolve, Ripple’s actions and communication will play a crucial role in shaping investor confidence and market sentiment.
XRP Technical Analysis:
Last week, XRP registered a price spike of 9% after it overcame the $0.54 resistance barrier, which now serves as a foundation for support. This critical breakthrough has shifted the market dynamic in favor of the bulls as they are now focusing on the subsequent targets at $0.60 and $0.68 levels.
Technical momentum indicators are also showing a bullish trend, suggesting that XRP is prepared to reach new record highs after this price surge. However, the rally needs to surmount the resistance at $0.60 in order to take the next step in its upward movement.
Support
Resistance
S1
0.5487
R1
0.5638
S2
0.5405
R2
0.5706
S3
0.5337
R3
0.5788
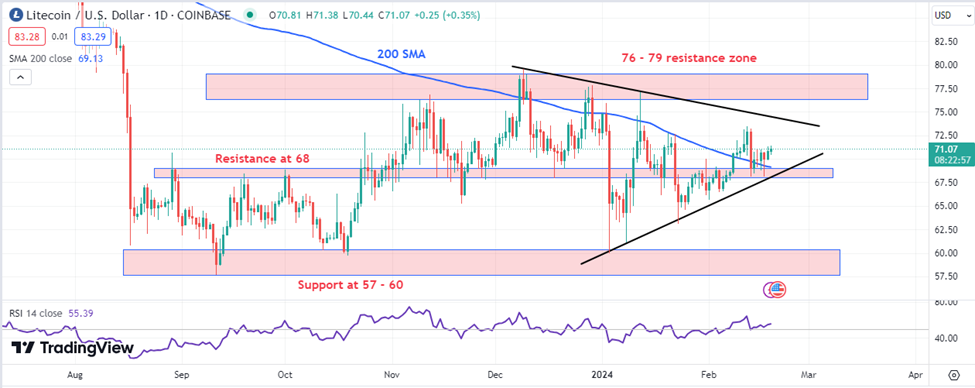
LTC: LTC price increased by 0.53% and 0.23% over 24 hours and the past seven days. The asset reached a low and high of $70.11 and $71.31, respectively.
Crypto analyst Chris on Crypto thinks Litecoin has a bright future. He believes it could go up a lot in value because regular money is losing its worth. Litecoin is like digital cash that’s cheap, reliable, and can’t be controlled by any one person. Chris says it’s a good investment, even though its current price doesn’t show how strong it really is compared to other cryptocurrencies.
LTC Technical Analysis:
LTC has recently exceeded its 200-day simple moving average, a major indicator of a change from a bearish to a bullish trend. A breakout from the current symmetrical triangle pattern may confirm the direction of a possible reversal to the uptrend.
For the short-term, the imminent trend is upward. However, the outlook for the medium term is neutral, suggesting a period of stabilization or uncertainty.
On the support and resistance front, the immediate support zone stands at $57-$60, a critical level that must be held in order to sustain the LTC’s short-term bullish trajectory. The asset has just crossed the important resistance zone of $68, which proves its current strength. The next critical resistance level is at $76-$79.
Support
Resistance
S1
69.96
R1
71.46
S2
69.14
R2
72.14
S3
68.46
R3
72.96
Vantage does not represent or warrant that the material provided here is accurate, current, or complete, and therefore should not be relied upon as such. The information provided here, whether from a third party or not, is not to be considered as a recommendation; or an offer to buy or sell; or the solicitation of an offer to buy or sell any financial instruments; or to participate in any specific trading strategy. Any research provided does not have regard to the specific investment objectives, financial situation and needs of any specific person who may receive it. We advise any readers of this content to seek their own advice. Without the approval of Vantage, reproduction or redistribution of this information is not permitted.
Vantage does not represent or warrant that the material provided here is accurate, current, or complete, and therefore should not be relied upon as such. The information provided here, whether from a third party or not, is not to be considered as a recommendation; or an offer to buy or sell; or the solicitation of an offer to buy or sell any financial instruments; or to participate in any specific trading strategy. Any research provided does not have regard to the specific investment objectives, financial situation and needs of any specific person who may receive it. We advise any readers of this content to seek their own advice. Without the approval of Vantage, reproduction or redistribution of this information is not permitted.