The worldwide crypto market is currently valued at $2.38 trillion, showing a slight increase of 1.37% in the past 24 hours. During this period, the total crypto market activity reached $110.12 billion, marking a 28.46% increase. In the decentralized finance (DeFi) sector, the volume stands at $9.56 billion, contributing 8.68% to the overall crypto market activity within the last day. Stablecoins make up a significant portion, totalling $97.44 billion and representing 88.48% of the total crypto market volume in the past 24 hours.
As for Bitcoin, its dominance has risen to 52.31%, showing a slight increase of 0.38% during the day.
BTC: BTC price increased by 2.43% and 22.96% over 24 hours and the past seven days.The asset reached a low and high of $61,435.02 and $64,268.81, respectively.
BlackRock’s Bitcoin ETF has made a splash in the investment world, amassing BlackRock’s Bitcoin ETF has made a splash in the investment world, amassing $10 billion in just seven weeks – a feat that took the first gold ETF over two years!0 billion in just seven weeks – a feat that took the first gold ETF over two years!
This rapid success not only highlights Bitcoin’s growing appeal but also signifies a shift in investment trends towards digital assets. BlackRock’s achievement underscores the role of traditional financial institutions in making cryptocurrencies accessible to a broader investor base. As digital assets continue to gain momentum, we’re witnessing an exciting evolution in investment strategies and portfolio management.
BTC Technical Analysis:
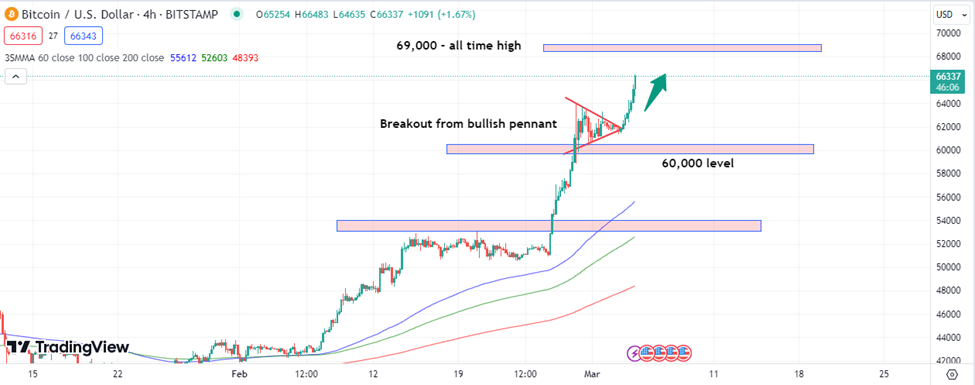
Bitcoin has now leaped over $65,000, marking a two-year high and making way to its all-time high of nearly $69,000 from November 2021. This rally was sparked as the price broke through a prominent bullish pennant pattern.
The technical indicators now reinforce this optimistic view, with the Moving Average Convergence Divergence (MACD) indicator remaining above the zero line and the price hovering above all moving averages.
Overall, the technical analysis paints a picture of cautious environment, with solid support at $60,000 acting as a safety net against significant downturns, signaling a bullish stance in the medium to long term.
Support
Resistance
S1
61939
R1
63766
S2
60757
R2
64411
S3
60112
R3
65593
ETH: ETH price increased by 1.37% and 11.54% over 24 hours and the past seven days. The asset reached a low and high of $3,372.21 and $3,528.52, respectively.
EigenLayer, a protocol that allows users to deposit and “re-stake” ether, has seen a tenfold increase in deposited assets, reaching $10 billion. This surge is attributed to continuous ether deposits and a rise in ether’s price. Since its launch on the Ethereum mainnet in June 2023, EigenLayer’s total value locked (TVL) skyrocketed to over $6 billion in just eight months. This growth underscores the increasing interest in protocols like EigenLayer that aim to secure third-party networks using staked digital assets.
ETH Technical Analysis:
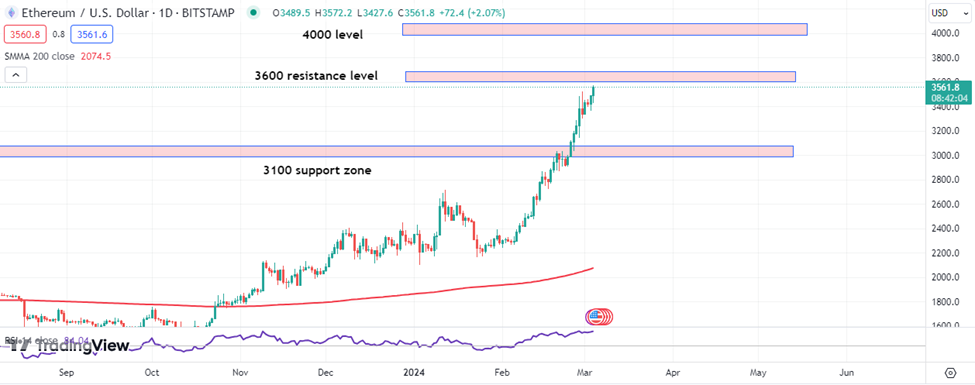
Ethereum’s daily chart reveals strong bullish momentum, pushing its price toward the critical $3600 resistance, a previous yearly high. Despite this resistance, the market’s outlook remains positive, with expectations of breaching this level soon. The next significant target for Ethereum is $4,000, acting as another resistance point.
While the bullish trend is evident, traders should watch for signs of consolidation or pullbacks, considering the balance between potential gains and short-term risks. Note that over-extended momentum indicators suggest potential buyer exhaustion, cautioning against relentless buying.
Top of Form
Support
Resistance
S1
3404.89
R1
3531.98
S2
3321.11
R2
3575.31
S3
3277.79
R3
3659.08
XRP: XRP price decreased by 1.27% and increased by 16.10% over 24 hours and the past seven days. The asset reached a low and high of $0.6025 and $0.6387, respectively.
Ripple’s strategic move of transferring a substantial volume of XRP into escrow has piqued interest in the crypto market. This action, following the release of 1 billion XRP, coincided with a surge in XRP’s value to over $0.62. Whale Alert, a blockchain tracking service, reported that Ripple executed three transactions, placing 800 million XRP into escrow. This move is seen as Ripple’s attempt to regulate XRP’s market supply, which has led to a noticeable increase in the cryptocurrency’s price. Market observers are closely watching these developments, viewing Ripple’s actions as a potential influencer of market dynamics.
XRP Technical Analysis:
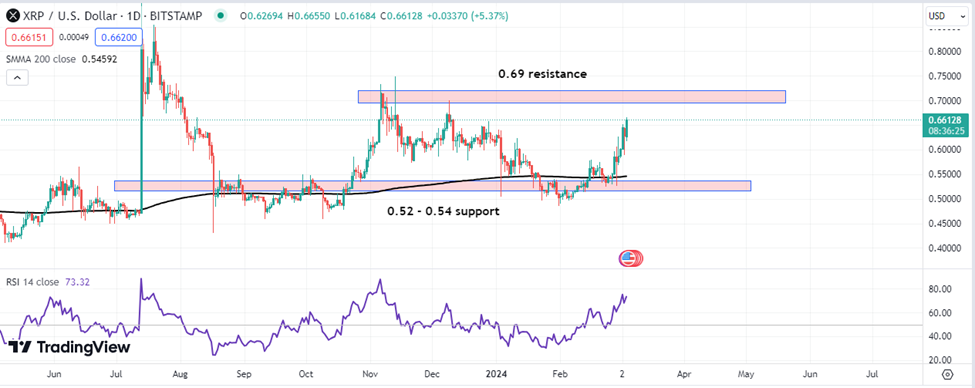
XRP showcased strength previous week, closing with an impressive 11% increase in price. The successful defense of the $0.52-$0.54 support level by buyers indicates a robust floor, providing a strong foundation for further bullish activity. The next significant milestone for XRP is the resistance at $0.69, which will be a critical level for bulls to overcome in their quest to push the price higher.
Looking forward, the outlook for XRP appears decidedly bullish. The alignment of multiple factors – the recovery from a correction phase, the defense of key support levels, and the surge in buying volume – collectively underscore a bullish scenario for XRP.
Support
Resistance
S1
0.5992
R1
0.6498
S2
0.5711
R2
0.6723
S3
0.5486
R3
0.7004
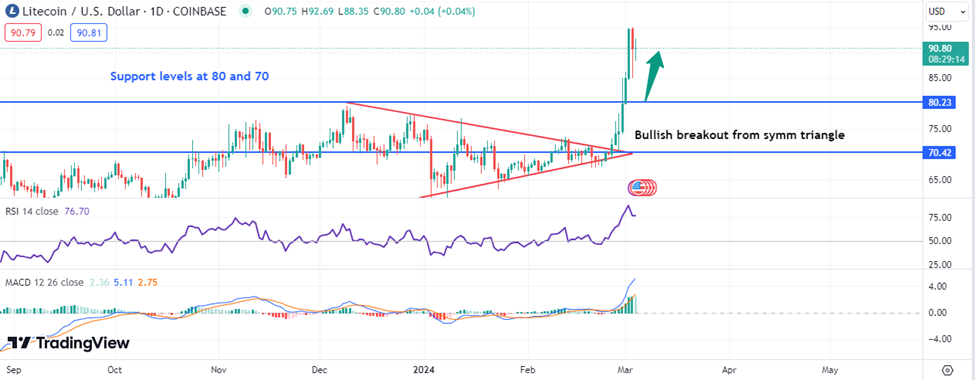
LTC: LTC price decreased by 1.91% and increased by 28.88% over 24 hours and the past seven days. The asset reached a low and high of $87.50 and $92.38, respectively.
Litecoin (LTC) is experiencing a surge in mining activity, driving its price above $82, a peak not seen since August 2023. Interestingly, despite this mining boom, the miner fees have stayed stable, hinting at a possible decrease in transaction volume. The Relative Strength Index (RSI) nearing 80 suggests a bullish market for LTC. However, it also serves as a cautionary signal of potential overbought conditions, warranting careful market observation.
LTC Technical Analysis:
Litecoin demonstrates a positive trend, highlighted by a significant 40% rally after a bullish breakout from a symmetrical triangle, pushing the price to $95. However, this rapid ascent led to an overbought condition, prompting a slight pullback.
Despite this, the asset’s momentum remains strong, as evidenced MACD line being above its signal line and the RSI stabilizing above 60.
The nearest support for LTC is identified at $80 and $70, and resistance levels at $95 and $115. Litecoin shows promise for continued upward movement, particularly if it can surpass the $95 zone, or alternatively, a dip to the $80 support level could present a valuable buying opportunity.
Support
Resistance
S1
85.64
R1
95.10
S2
80.62
R2
99.53
S3
76.19
R3
104.55
Vantage does not represent or warrant that the material provided here is accurate, current, or complete, and therefore should not be relied upon as such. The information provided here, whether from a third party or not, is not to be considered as a recommendation; or an offer to buy or sell; or the solicitation of an offer to buy or sell any financial instruments; or to participate in any specific trading strategy. Any research provided does not have regard to the specific investment objectives, financial situation and needs of any specific person who may receive it. We advise any readers of this content to seek their own advice. Without the approval of Vantage, reproduction or redistribution of this information is not permitted.
Vantage does not represent or warrant that the material provided here is accurate, current, or complete, and therefore should not be relied upon as such. The information provided here, whether from a third party or not, is not to be considered as a recommendation; or an offer to buy or sell; or the solicitation of an offer to buy or sell any financial instruments; or to participate in any specific trading strategy. Any research provided does not have regard to the specific investment objectives, financial situation and needs of any specific person who may receive it. We advise any readers of this content to seek their own advice. Without the approval of Vantage, reproduction or redistribution of this information is not permitted.