The worldwide crypto market is currently valued at $2.63 trillion, showing a slight decrease of 1.52% in the past 24 hours. During this period, the total crypto market activity reached $94.24 billion, marking a 50.59% increase. In the decentralized finance (DeFi) sector, the volume stands at $9.26 billion, contributing 9.83% to the overall crypto market activity within the last day. Stablecoins make up a significant portion, totaling $83.93 billion and representing 89.06% of the total crypto market volume in the past 24 hours.
As for Bitcoin, its dominance has risen to 52.04%, showing a slight increase of 0.10% during the day.
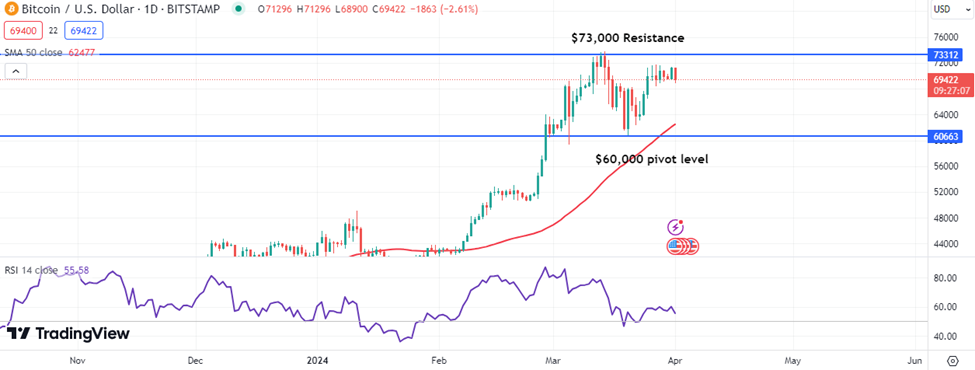
BTC: BTC price decreased by 1.01% and increased by 4% over 24 hours and the past seven days.The asset reached a low and high of $68,986.95 and $71,377.78, respectively.
Bitcoin Cash (BCH), a cryptocurrency resulting from a Bitcoin hard fork, has recently surged to a three-year high. Its value has soared by over 120% in the past month, reaching an impressive $699.45. The surge is attributed to increased transactions, reflected in a 190% rise in trading volume to $1.4 billion. Despite this growth, BCH remains 84% below its all-time high from six years ago. The upcoming Bitcoin Cash halving event and favorable market conditions contribute to its upward trajectory.
BTC Technical Analysis:
The 1-Day chart for Bitcoin exhibits a picture of uncertainty following a significant downturn, suggesting we might be entering a period of stabilization or an impending trend reversal. For those bullish on Bitcoin, it’s advisable to wait for a clear bullish candlestick formation or for the price to break above the critical $73,000 threshold before initiating long positions.
On the flip side, the inability to climb past recent peak may present an excellent chance for short sellers to target the $60,000 pivot zone. However, the broader perspective reinforces the importance of strategic planning in trading, given the lack of a prevailing trend.
Support
Resistance
S1
70221
R1
72013
S2
69040
R2
72624
S3
68429
R3
73805
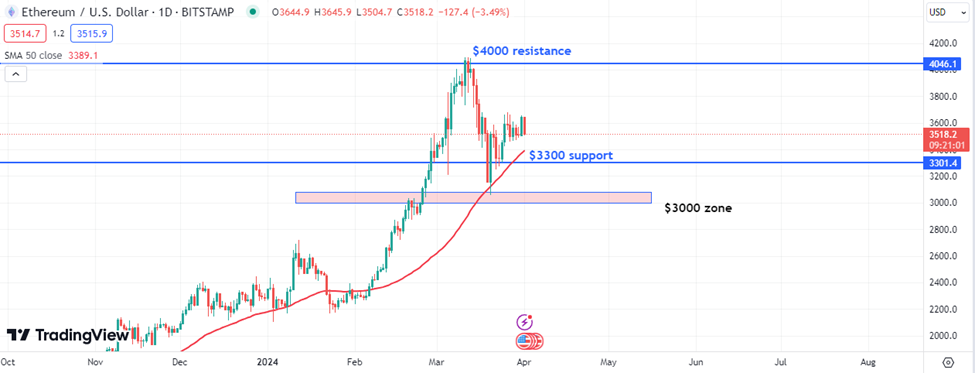
ETH: ETH price decreased by 1.58% and increased by 2.95% over 24 hours and the past seven days. The asset reached a low and high of $3,505.65 and $3,655.22, respectively.
The Ethereum ecosystem is currently undergoing a profound transformation with the introduction of a groundbreaking protocol simplification strategy coined as the “Purge” plan. This initiative, championed by none other than Ethereum co-founder Vitalik Buterin, seeks to revolutionize the Ethereum protocol by streamlining its intricate framework and alleviating the strain on node resources. The crux of the “Purge” plan, as delineated in a recent publication, is to untangle the convoluted web of Ethereum’s operations while concurrently boosting its operational efficiency. By doing so, the plan aims to achieve a delicate balance between simplifying the protocol’s mechanics and fortifying its security measures.
ETH Technical Analysis:
Ethereum’s recent corrective phase seems to have concluded, though its price has struggled to make significant gains above the crucial support level of $3,300.
On longer timeframes, the momentum for Ethereum remains bullish, although it has shown some underperformance recently, especially when compared to Bitcoin, which has seen notable over performance.
Looking forward, for Ethereum to regain its competitive edge and drive the market upwards, it must successfully breach the $4,000 resistance mark. Failing to do so could see it retracing back towards the $3,000 level and further down, indicating potential reversal of trend.
Support
Resistance
S1
3550
R1
3698
S2
3453
R2
3749
S3
3402
R3
3846
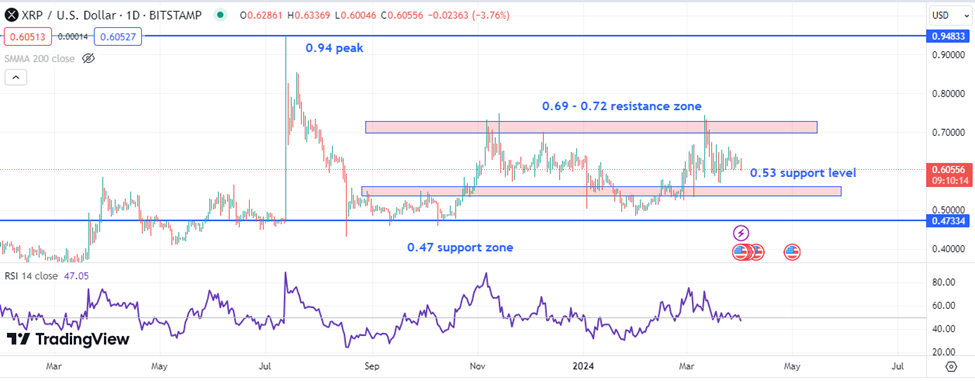
XRP: XRP price decreased by 2.33% and 2.68% over 24 hours and the past seven days. The asset reached a low and high of $0.6059 and $0.632, respectively.
Ripple CTO David Schwartz responded to a proposal suggesting donating XRP tokens from Ripple’s escrow to the XRP Ledger Foundation (XRPLF). While the proposal aims to benefit the XRP community, Schwartz deems it infeasible due to challenges in ensuring responsible usage. He encourages the XRP community to consider the implications of maintaining control for prudence and long-term sustainability.
XRP Technical Analysis:
In a rather steady state, XRP has not managed to escape its trading boundaries. It is hovering between support and resistance levels at 0.53 and 0.69-0.72, respectively. This uncertain scenario has been playing out for several months, with XRP yet to achieve a significant breakthrough. The most notable peak in recent times was reached in July 2023, when it climbed to 0.94.
Looking to the future, XRP must successfully push past the resistance level to draw buyers back. If it fails to do so, we may see a bearish trend targeting the 0.47 and 0.41 levels.
Support
Resistance
S1
0.6231
R1
0.6325
S2
0.6171
R2
0.6359
S3
0.6136
R3
0.6419
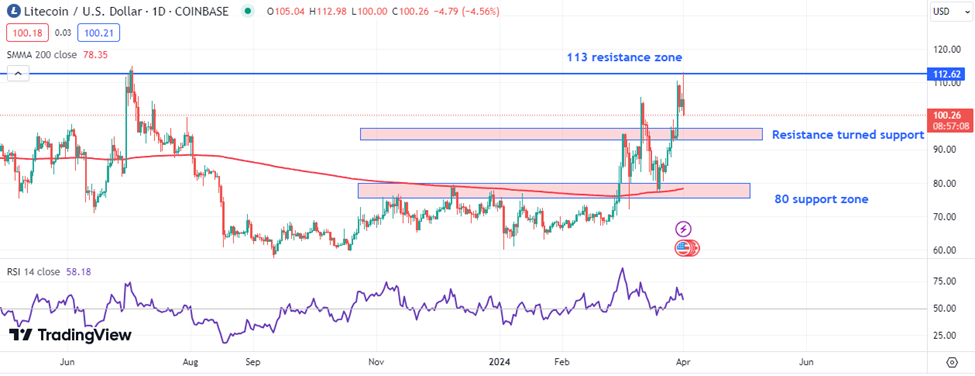
LTC: LTC price increased by 2.66% and 17.01% over 24 hours and the past seven days. The asset reached a low and high of $101.73 and $112.32, respectively.
Litecoin (LTC) has surged remarkably, securing the second-best position among the top 100 cryptocurrencies. Over the past 7 days, its price soared by 24%, surpassing the $100 mark. This surge is partly attributed to a statement by the United States Commodity Futures Trading Commission (CFTC), which classified Litecoin as a commodity in a lawsuit against crypto exchange KuCoin. This classification places Litecoin beyond the jurisdiction of the Securities and Exchange Commission (SEC), allowing it to operate with less stringent regulations related to securities.
LTC Technical Analysis:
Litecoin’s price is showcasing a bullish narrative, adhering to an uptrend across the board. After a rebound from the $80 support level, it surged to the $113 resistance, marking yet another higher high.
In terms of momentum, things are also looking optimistic as the RSI stands strong above 55, signaling bullish momentum.
When it comes to key levels to watch, the nearest support zone lies at $95, which previously acted as resistance, followed by the $80 mark. On the flip side, the nearest resistance zones to keep an eye on are at $113 and then $130, outlining clear targets for the next potential moves.
Support
Resistance
S1
102.01
R1
107.26
S2
99.34
R2
109.47
S3
97.13
R3
112.32
Vantage does not represent or warrant that the material provided here is accurate, current, or complete, and therefore should not be relied upon as such. The information provided here, whether from a third party or not, is not to be considered as a recommendation; or an offer to buy or sell; or the solicitation of an offer to buy or sell any financial instruments; or to participate in any specific trading strategy. Any research provided does not have regard to the specific investment objectives, financial situation and needs of any specific person who may receive it. We advise any readers of this content to seek their own advice. Without the approval of Vantage, reproduction or redistribution of this information is not permitted.
Vantage does not represent or warrant that the material provided here is accurate, current, or complete, and therefore should not be relied upon as such. The information provided here, whether from a third party or not, is not to be considered as a recommendation; or an offer to buy or sell; or the solicitation of an offer to buy or sell any financial instruments; or to participate in any specific trading strategy. Any research provided does not have regard to the specific investment objectives, financial situation and needs of any specific person who may receive it. We advise any readers of this content to seek their own advice. Without the approval of Vantage, reproduction or redistribution of this information is not permitted.