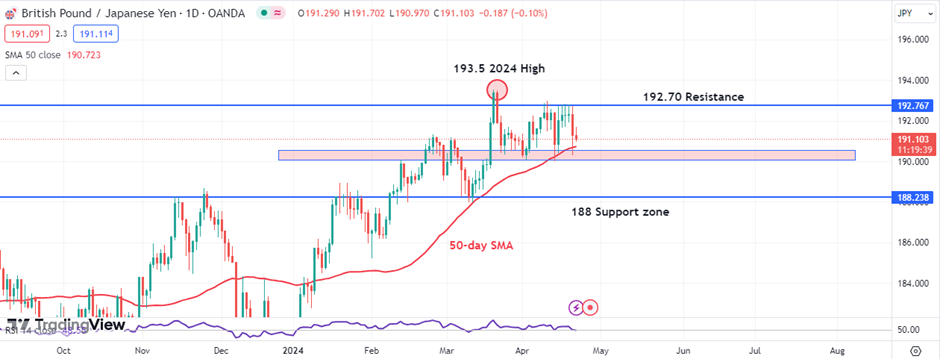
– The GBPJPY pair risks breaching the 192.70 resistance level, potentially escalating to 193.55 or even 195.00, while a decline could see support around 190, leading to further drops.
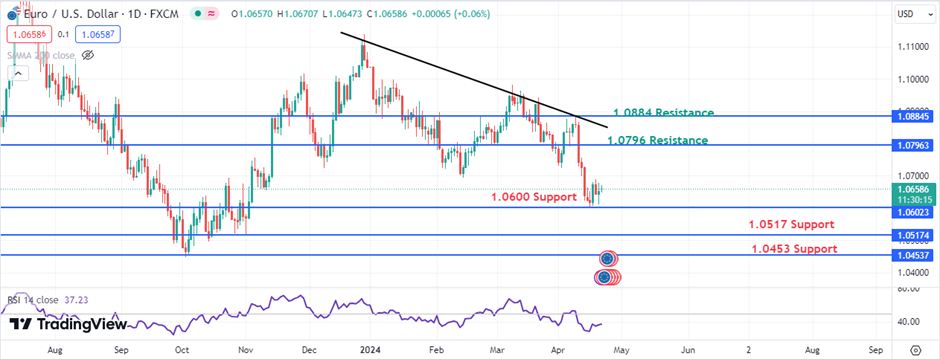
– The EUR/USD pair faces downside risks after dropping below 1.0693 following high inflation data. Whereas, a bullish reversal might encounter resistance at 1.0693 and 1.0722, aiming for 1.0884.
JPY (JPY): BoJ Interest Rate Decision
Bank of Japan (BOJ) policy board members come to a consensus on where to set the rate. Traders watch interest rate changes closely as short term interest rates are the primary factor in currency valuation.
A higher than expected rate is positive/bullish for the JPY, while a lower than expected rate is negative/bearish for the JPY.
The previous reading was 0.10%, same as expected. The next report is due on April 25, 2024 at 03:00 GMT. Its forecast stands at 0.10%.
GBPJPY Technical Analysis:
The GBPJPY pair is currently trading just below a key resistance level at 192.70. It is crucial for sellers to maintain this level to prevent any upward movement. If they fail to hold this line, we could see the pair pushing towards the 2024 highs around 193.55. Further gains could potentially extend to the psychologically significant level of 195.00.
Conversely, if the pair faces rejection at its current level and starts to decline, it will find initial support between 190.00 and 190.60. This support zone is particularly strong as it coincides with a rising trendline and the 50-day simple moving average.
If the pair breaks below this support, it could trigger a stronger bearish momentum, potentially leading to a drop towards 188 zone.Top of Form
Pivot Points: GBPJPY
Support
Resistance
S1
191.15
R1
191.5
S2
190.93
R2
191.63
S3
190.8
R3
191.85
US (USD): U.S. Core PCE Price Index MoM
The Core Personal Consumption Expenditure (PCE) Price Index measures the changes in the price of goods and services purchased by consumers for the purpose of consumption, excluding food and energy. Prices are weighted according to total expenditure per item. It measures price change from the perspective of the consumer. It is a key way to measure changes in purchasing trends and inflation.
A higher than expected reading should be taken as positive/bullish for the USD, while a lower than expected reading should be taken as negative/bearish for the USD.
The previous actual data was 0.3%, similar to the forecast. The upcoming report is due on April 26, 2024 at 12:30 GMT and its forecast figure also stands at 0.3%.
EURUSD Technical Analysis:
The EUR/USD pair took a dive following a surprisingly high inflation report on April 10, dropping below its lowest level for 2024 at 1.0693. It briefly stabilized at a five-month low of 1.0600, but has not shown a strong recovery yet. Further declines could see it revisit or drop below this low, testing deeper support levels at 1.0517 and 1.0453.
On the brighter side, if the trend shifts to bullish, the pair could face some resistance at 1.0693 and 1.0722 before possibly climbing higher towards 1.0796, a key level throughout the year, and potentially reaching as high as 1.0884.
Pivot Points: EURUSD
Support
Resistance
S1
1.0651
R1
1.0665
S2
1.0644
R2
1.0672
S3
1.0637
R3
1.0679
Vantage does not represent or warrant that the material provided here is accurate, current, or complete, and therefore should not be relied upon as such. The information provided here, whether from a third party or not, is not to be considered as a recommendation; or an offer to buy or sell; or the solicitation of an offer to buy or sell any financial instruments; or to participate in any specific trading strategy. Any research provided does not have regard to the specific investment objectives, financial situation and needs of any specific person who may receive it. We advise any readers of this content to seek their own advice. Without the approval of Vantage, reproduction or redistribution of this information is not permitted.
Vantage does not represent or warrant that the material provided here is accurate, current, or complete, and therefore should not be relied upon as such. The information provided here, whether from a third party or not, is not to be considered as a recommendation; or an offer to buy or sell; or the solicitation of an offer to buy or sell any financial instruments; or to participate in any specific trading strategy. Any research provided does not have regard to the specific investment objectives, financial situation and needs of any specific person who may receive it. We advise any readers of this content to seek their own advice. Without the approval of Vantage, reproduction or redistribution of this information is not permitted.