The worldwide crypto market is currently valued at $2.31 trillion, showing a slight decrease of 3.02% in the past 24 hours. During this period, the total crypto market activity reached $55.19 billion, marking a 5.98% increase. In the decentralized finance (DeFi) sector, the volume stands at $5.21 billion, contributing 9.44% to the overall crypto market activity within the last day. Stablecoins make up a significant portion, totalling $49.79 billion and representing 90.22% of the total crypto market volume in the past 24 hours.
As for Bitcoin, its dominance has risen to 53.09%, showing a slight increase of 0.27% during the day.
BTC: BTC price decreased by 2.90% and 6.40% over 24 hours and the past seven days.The asset reached a low and high of $62,078.97 and $64,025.64, respectively.
Post-Bitcoin halving, the crypto market is abuzz with talks of a potential ‘supercycle’, a prolonged period of growth beyond the usual boom-and-bust cycles. This speculation is fueled by factors like increased institutional adoption and growing investor confidence. Amidst this, Galaxy Fox, a new ICO project, is gaining attention in the meme/gamefi market.
The halving event, which reduces the reward for mining new blocks, has historically triggered price surges, and is seen as a key driver in the market. Lucie from the Shiba Inu team suggests that Bitcoin might be on the verge of a long bull run.
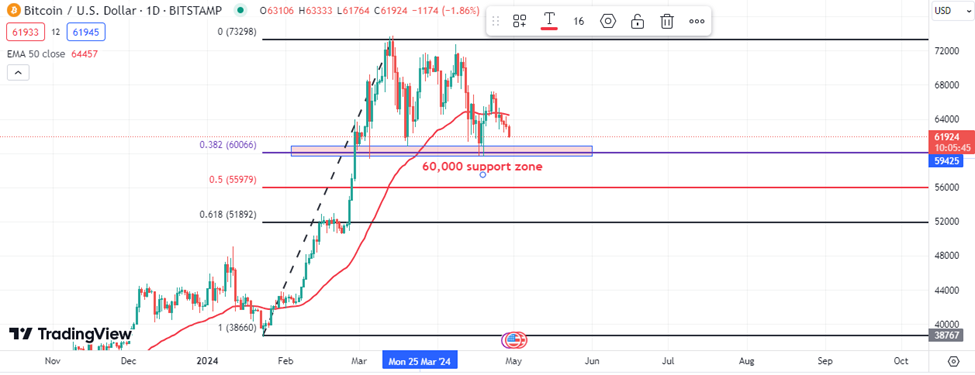
BTC Technical Analysis:
BTC suggests a bearish outlook, with a focus on a target price of $60,000, which aligns with the 38.2% Fibonacci correction level. This sentiment is further supported by downward pressure from the 50-day Exponential Moving Average.
For this bearish trend to persist, it is essential for Bitcoin’s price to stay below $65,300. However, if the price surpasses this level, it could indicate a halt to the ongoing bearish correction and a possible resurgence of the overall bullish trend.
Support
Resistance
S1
62610
R1
64156
S2
61994
R2
65086
S3
61064
R3
65702
ETH: ETH price decreased by 4.39% and 1.60% over 24 hours and the past seven days. The asset reached a low and high of $3,171.33 and $3,351.18, respectively.
Tron’s CEO, Justin Sun, has expressed opposition to the approval of the Ethereum ETF, citing the unpredictability of direct crypto approvals. He highlights a lack of understanding in the regulatory space as a major issue. The crypto community is increasingly skeptical about ETF approvals, given recent tense interactions with the SEC. Industry players are preparing for potential application rejections, reflecting growing tension with regulators. The lengthy application process is seen as significant not just for applicants, but for the entire market, influencing investment strategies and market stability.
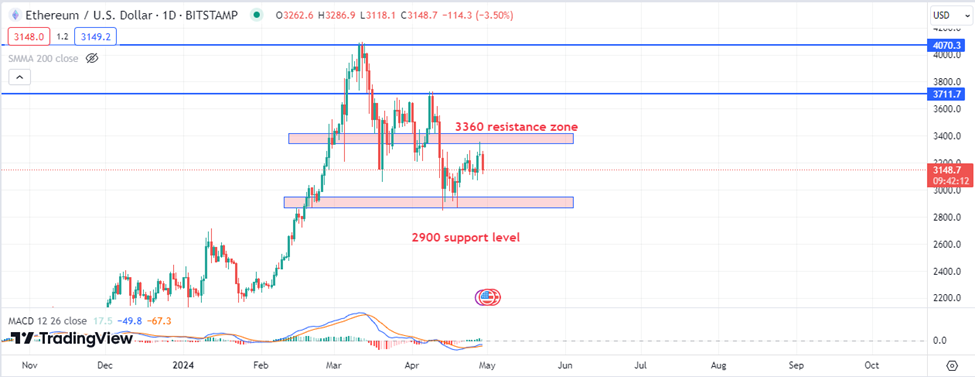
ETH Technical Analysis:
Ethereum’s downward momentum might be slowing down, as it is opting for a sideways movement above a critical support level.
Right now, Ethereum is trading within a defined range, with support around $2,900 and resistance at $3,370. The longer it stays within this range without making significant moves, the more significant the eventual breakout might be.
Looking forward, there is a positive sign with a bullish cross on the daily MACD, which could empower the bulls. However, if Ethereum fails to break through key resistance levels, we could see the continuation of the downward trend, possibly exploring new lows.
Support
Resistance
S1
3225
R1
3322
S2
3189
R2
3383
S3
3128
R3
3419
XRP: XRP price decreased by 4.48% and 6.48% over 24 hours and the past seven days. The asset reached a low and high of $0.4996 and $0.5246 respectively.
XRP, affiliated with Ripple, is facing a downturn against Bitcoin for the ninth consecutive month, down 72% since Ripple’s partial legal victory against the U.S. SEC last July. Despite reaching an all-time high in May 2017, it’s now down by a staggering 97%. A U.S. District Court Judge ruled that XRP’s secondary sales are not a securities offering, causing a brief price rally. Ripple is still under scrutiny, with the SEC demanding a $2 billion fine for violating securities offerings, which Ripple aims to reduce to $10 million. The impact of these legal developments on XRP’s price remains uncertain.
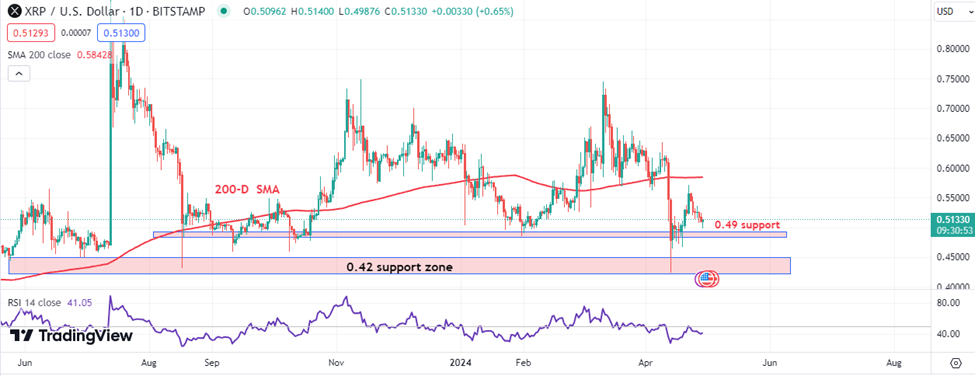
XRP Technical Analysis:
XRP has recently taken a sharp plunge, dropping beneath its 200-day moving average. Despite this, it has found some stability at the $0.49 support zone, where it is currently consolidating.
Should XRP manage to climb back above the 200-day moving average, there is potential for of the start of a bullish trend. Conversely, if it slips below the $0.49 mark, the existing bearish trend could intensify, potentially leading to further declines in its market value.
Support
Resistance
S1
0.5042
R1
0.5207
S2
0.4983
R2
0.5311
S3
0.4878
R3
0.5371
LTC: LTC price decreased by 3.33% and 4.15% over 24 hours and the past seven days. The asset reached a low and high of $81.96 and $85.48 respectively.
Litecoin (LTC) is surging, fueled by its upcoming August 2024 halving. Halvings, which cut miner rewards, have historically boosted LTC’s price, but future results are uncertain. Coinbase’s launch of LTC futures adds another layer of intrigue, potentially impacting the price in the coming months. This mix of potential reward and uncertainty makes Litecoin an interesting watch for investors.
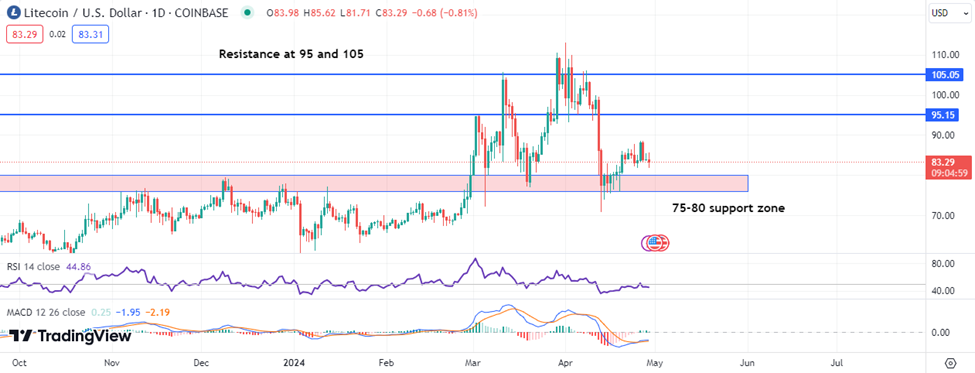
LTC Technical Analysis:
Currently, the LTC price is nearing a support range between $75 and $80, presenting a potential opportunity for a bullish swing trade.
As for momentum, the MACD line is above the signal line, which is typically a bullish indicator. However, the RSI is hovering around 45-50, suggesting a neutral stance.
In terms of support and resistance levels, the immediate support zone is at $80, followed by $65. On the flip side, resistance is first found at $95, with further hurdles at $105 and then $115.
Top of Form
Support
Resistance
S1
83.26
R1
85.04
S2
82.55
R2
86.12
S3
81.47
R3
86.83
Vantage does not represent or warrant that the material provided here is accurate, current, or complete, and therefore should not be relied upon as such. The information provided here, whether from a third party or not, is not to be considered as a recommendation; or an offer to buy or sell; or the solicitation of an offer to buy or sell any financial instruments; or to participate in any specific trading strategy. Any research provided does not have regard to the specific investment objectives, financial situation and needs of any specific person who may receive it. We advise any readers of this content to seek their own advice. Without the approval of Vantage, reproduction or redistribution of this information is not permitted.
Vantage does not represent or warrant that the material provided here is accurate, current, or complete, and therefore should not be relied upon as such. The information provided here, whether from a third party or not, is not to be considered as a recommendation; or an offer to buy or sell; or the solicitation of an offer to buy or sell any financial instruments; or to participate in any specific trading strategy. Any research provided does not have regard to the specific investment objectives, financial situation and needs of any specific person who may receive it. We advise any readers of this content to seek their own advice. Without the approval of Vantage, reproduction or redistribution of this information is not permitted.