The downward trend in crypto markets appears to be continuing. In general, new downside potential could now emerge, as the last trading week has shown us. However, isolated impulses paint a mixed picture and could indicate positive momentum. In this case, it remains to be seen how stock markets will move and what the US Dollar has to offer. The NFP- report in particular could provide further clarity here.
If further losses in the Dollar follow this week, the crypto market could recover and provide upside potential overall. It is also worth noting that markets moved positively especially during Asian trading hours, before selling off again during US trading.
Technical analysis:
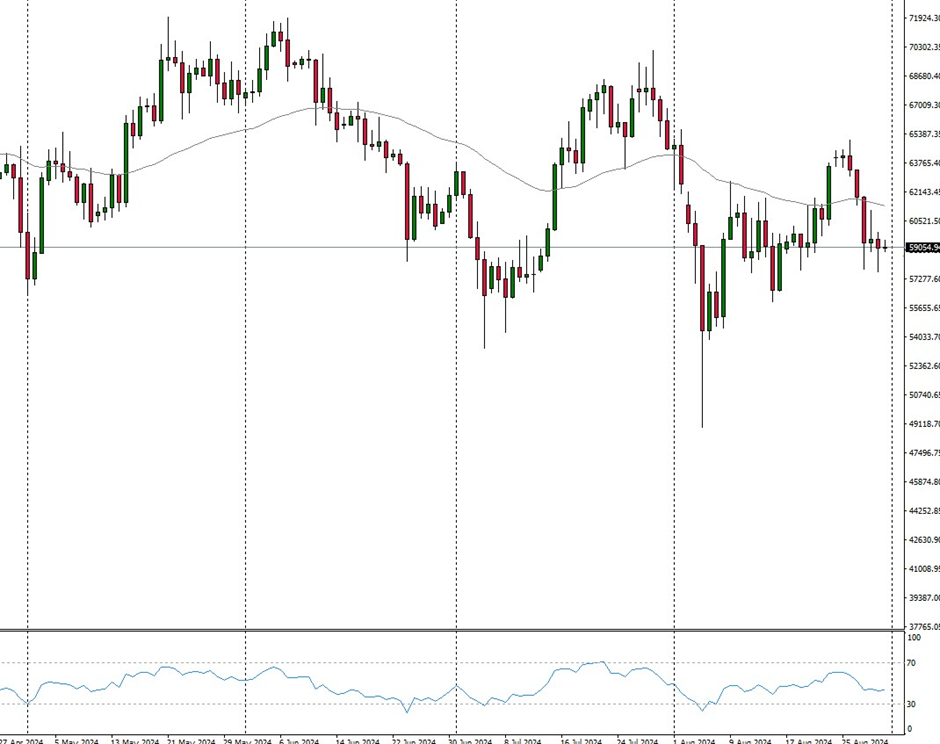
– BTC: Bitcoin is trading at USD 59,079. The market moved downwards again last week, after a possible upward breakout had previously emerged. However, the positive momentum did not last long and the market was once again defeated.
The daily chart for Bitcoin now indicates that there could be further downside potential if the market is unable to hold the floor at USD 59,000. A price slide towards the upcoming USD 55,000 zone could then be on the cards.
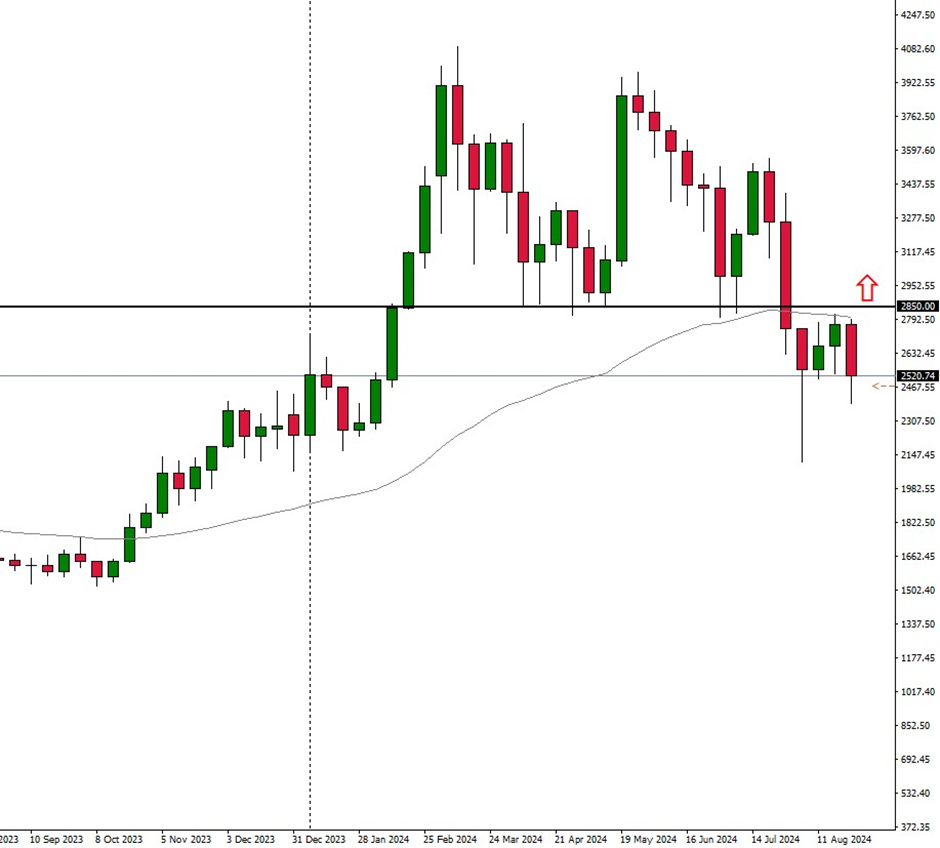
– ETH: Ethereum is trading at USD 2,522. The market remains rather weak. However, the weekly chart shows that the bottom formation in the area of the psychological price mark at USD 2,500 may continue. This could now lead to further upward potential.
The weekly chart above shows the important pinch point that prevented the market from falling further four weeks ago. However, potential is only likely to materialize above the psychological price mark of USD 2,850. The 50- moving average also limits the market’s upside.
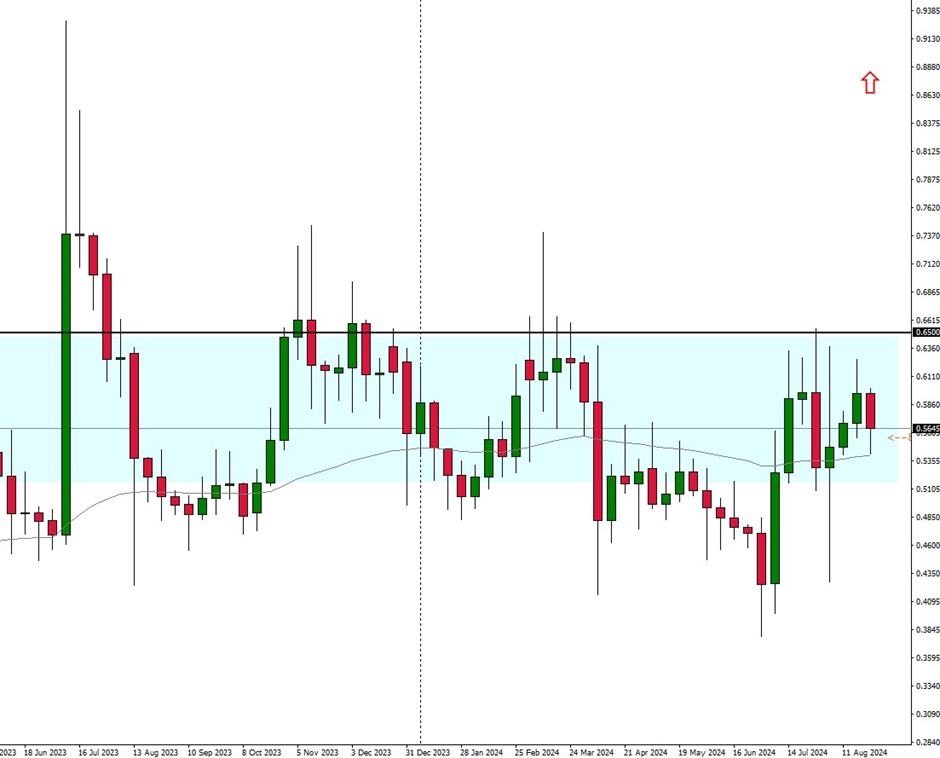
– XRP: Ripple is trading at USD 0.5710. The breakout with further upward potential is still a long time coming. Only a break above the resistance zone at USD 0.6500, which was also analyzed last week, should release further momentum here.
If the market remains trapped in the sideways pattern shown in light blue in the chart above, prices could fall further. A stronger Dollar could also consolidate this trend.
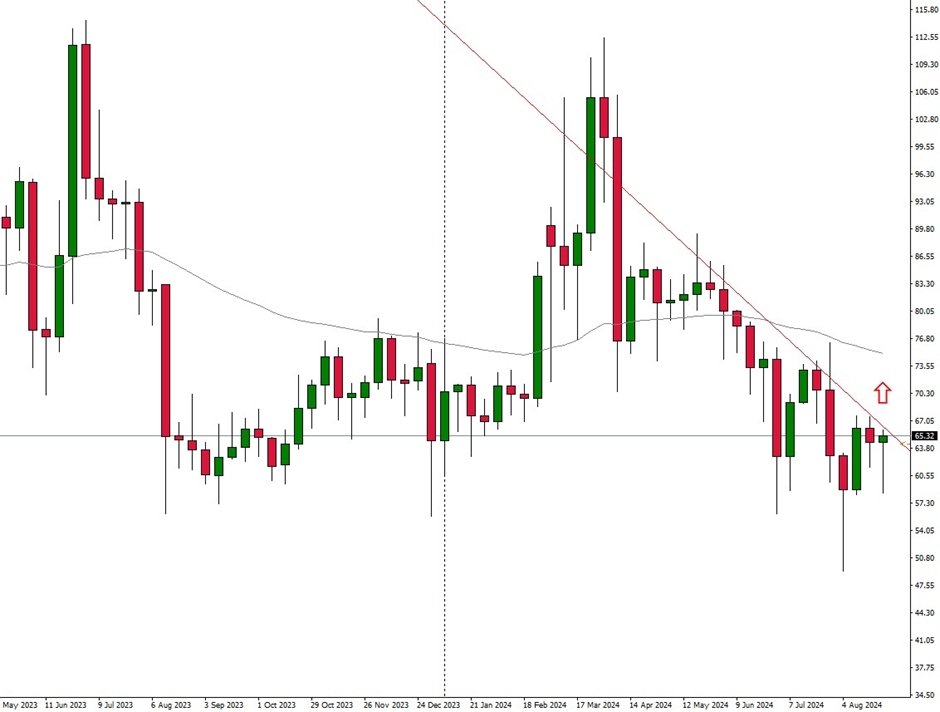
– LTC: Litecoin is trading at USD 66.19 and there could be further momentum in the chart. Is this the long-awaited breakout to the upside that we are now seeing? Overall, an upward breakout could quickly release fresh momentum.
However, the Litecoin chart shows that the red- colored resistance zone must first be overcome on the upside. If this zone is broken, the price could quickly move up to the 50- moving average in the USD 75.00 range. At the moment, the signs are still green, especially for Litecoin.
Vantage does not represent or warrant that the material provided here is accurate, current, or complete, and therefore should not be relied upon as such. The information provided here, whether from a third party or not, is not to be considered as a recommendation; or an offer to buy or sell; or the solicitation of an offer to buy or sell any financial instruments; or to participate in any specific trading strategy. Any research provided does not have regard to the specific investment objectives, financial situation and needs of any specific person who may receive it. We advise any readers of this content to seek their own advice. Without the approval of Vantage, reproduction or redistribution of this information is not permitted.