Crypto outlook | bearish trends and future outlook
Vantage Plus Research Team October 7, 2024
Fundamental Data
Last week, the crypto market faced significant bearish momentum, with Ethereum dropping 9% from USD 2,662 to USD 2,410, while Bitcoin retraced from USD 65,710 to USD 59,842, dropping 9% on stronger-than-expected NFP data at 254K. In particular the stronger Dollar causes prices to weaken. XRP tanked after the SEC’s appeal in the Ripple case and the situation is likely to remain tricky in the coming months moving forward. Amid geopolitical tensions and the upcoming US Presidential election, the ‘debasement trade’ is poised to strengthen, favoring both Bitcoin (BTC) and gold. In this case a certain rush of investors to the above- mentioned assets might be seen.
Technical Analysis:
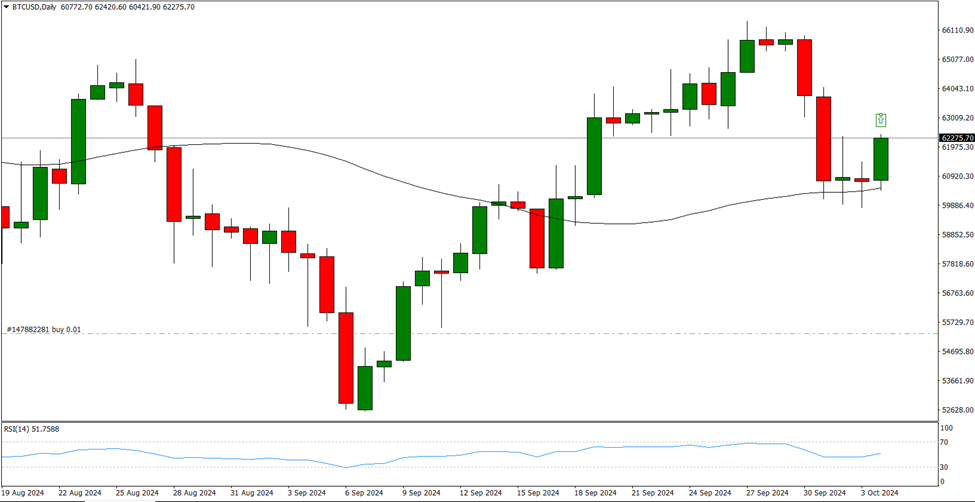
BTC – On the weekly chart, BTCUSD is in a bearish trend, opening at USD 65,710, hitting a low of USD 59,842 and a high of USD 59,845, currently trading around USD 61,988. The daily chart shows the 50 MA rejecting bearish price action; if this support zone holds, bullish momentum could propel BTC to USD 66,398 and USD 70,012. Conversely, a downside crossover of the 50 MA may signal further declines.
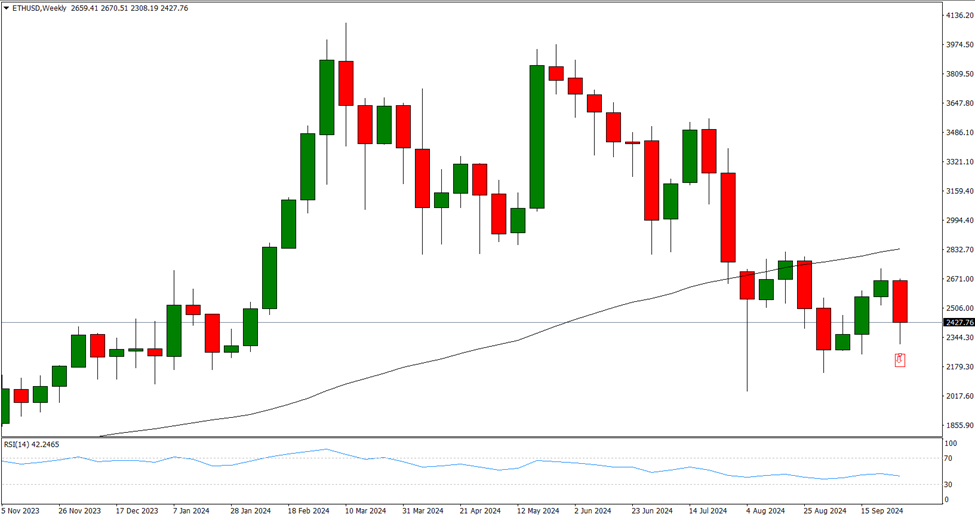
ETH – On the weekly chart, ETHUSD displays a bearish trend, opening at USD 2,662 and trading around USD 2,410, with a weekly low of USD 2,305 and a high of USD 2,663. Currently the market trades below the 50 MA, further downside is likely, targeting USD 2,306 and USD 2,146. However, a breakout above the 50 MA could signal a potential trend reversal to bullish.
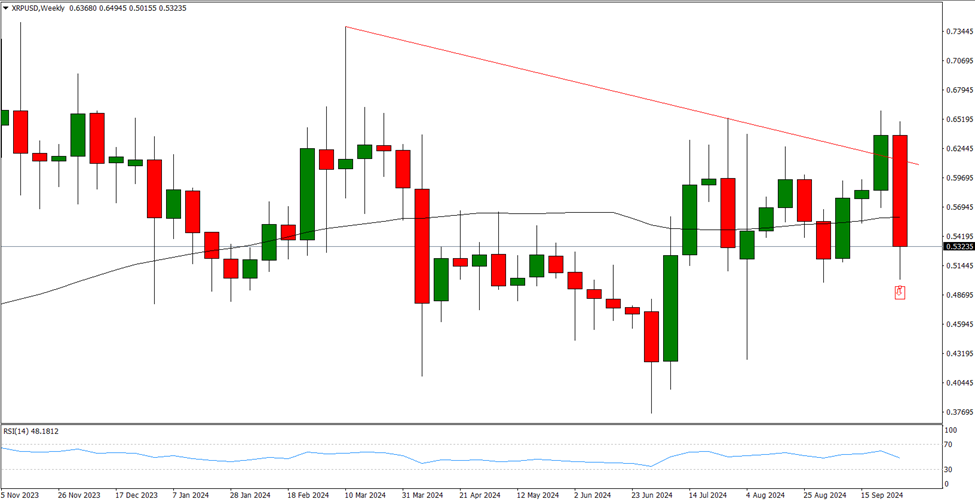
XRP – The weekly chart for XRPUSD shows a bearish trend, opening at USD 0.6360 and currently at USD 0.5250, with a weekly low of USD 0.1501 and a high of USD 0.6490. A fresh candlestick has crossed below the 50 MA, confirming a downtrend with rejection at the downtrend line. If this crossover holds, the price could target support levels at USD 0.4970 and USD 0.4250; however, if the crossover fails, a bullish reversal may push prices higher. This seems unlikely, though. Last week’s bearish price action with the strong negative candlestick might suggest the market will fall further.
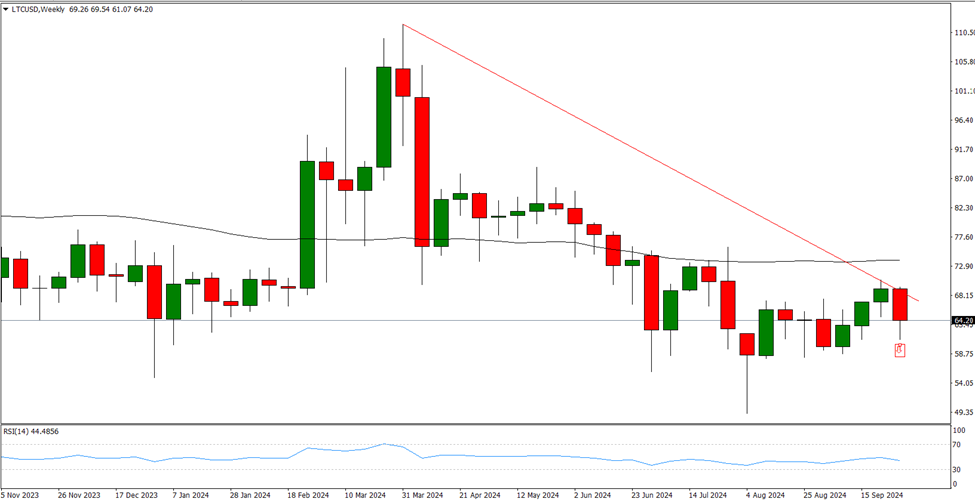
LTC – On the weekly chart, LTCUSD opened at USD 69.00, hitting a low of USD 61.00 and a high of 69.00, currently trading at USD 64.40. The candlestick remains below the 50 MA, with a downtrend line rejecting price, indicating a bearish trend. If it stays under the 50 MA, further declines to USD 58.00 and USD 49.00 are probable; however, a breakout above the 50 MA could signal a potential bullish reversal.
For this to happen, the market should first clear the psychological level of USD 70.00, where also the falling trendline in red color emerges.
Vantage does not represent or warrant that the material provided here is accurate, current, or complete, and therefore should not be relied upon as such. The information provided here, whether from a third party or not, is not to be considered as a recommendation; or an offer to buy or sell; or the solicitation of an offer to buy or sell any financial instruments; or to participate in any specific trading strategy. Any research provided does not have regard to the specific investment objectives, financial situation and needs of any specific person who may receive it. We advise any readers of this content to seek their own advice. Without the approval of Vantage, reproduction or redistribution of this information is not permitted.
Vantage does not represent or warrant that the material provided here is accurate, current, or complete, and therefore should not be relied upon as such. The information provided here, whether from a third party or not, is not to be considered as a recommendation; or an offer to buy or sell; or the solicitation of an offer to buy or sell any financial instruments; or to participate in any specific trading strategy. Any research provided does not have regard to the specific investment objectives, financial situation and needs of any specific person who may receive it. We advise any readers of this content to seek their own advice. Without the approval of Vantage, reproduction or redistribution of this information is not permitted.