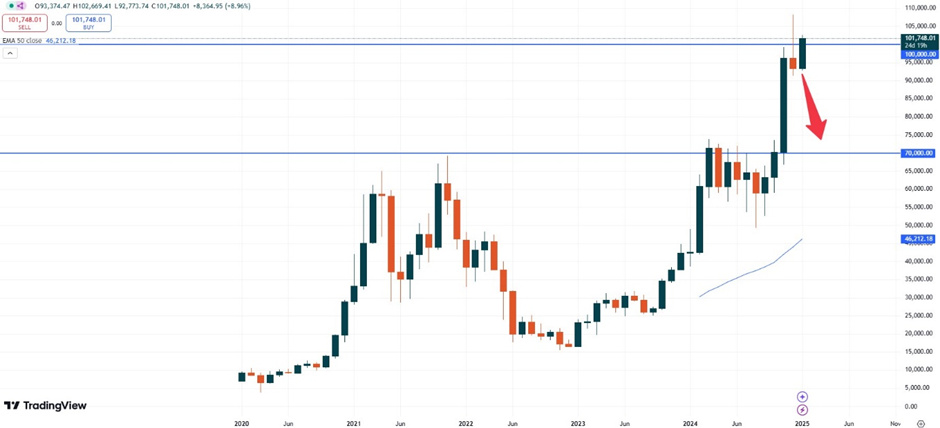
Market data shows, that the realized price in Bitcoin sits at USD 65.900 for last year. Furthermore, unrealized profits accumulate for about 40%. The realized price zone is important as it oftentimes helps to identify a support level, which the market barely traded below in the past, should a correction occur. After last year’s strong positive momentum, where the price had more than doubled, traders should pay attention to potential profit taking. This could make the market vulnerable for falling prices.
Technical analysis:
– BTC: Bitcoin is trading at USD 101,600. The early days shows some upside in Bitcoin, which still might be limited. The upside might take a turnaround in the following weeks towards the end of January and the technical bearish pinbar candlestick pattern would also support such view.
The general positive trend seems to be intact but is still due for a potential correction. A stronger Dollar might also cause the market to move lower. The previous breakout zone at USD 71,000 could then offer support should a correction occur.
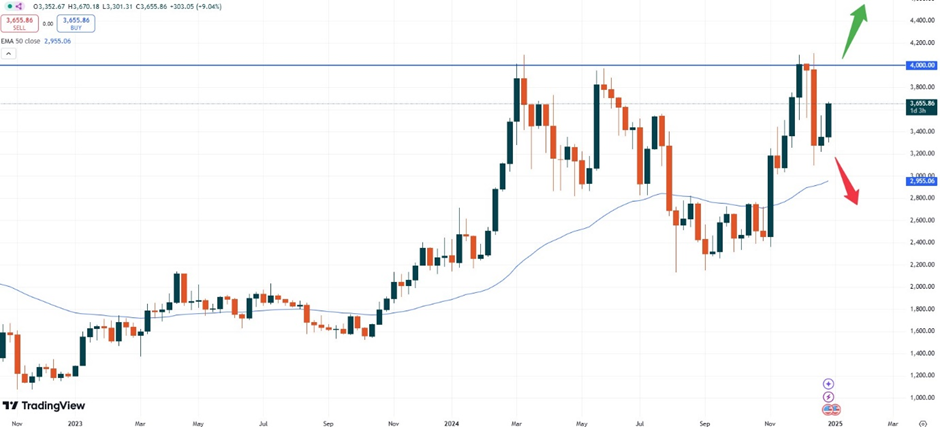
– ETH: Ethereum is currently trading at USD 3,655.80. The positive sentiment in Bitcoin can also be seen in the ETH market. With the recent gains, the upside might continue to higher levels. If Ether is able to also break the USD 3,900.00 zone more positivity might be seen.
At that zone the general strong resistance area might hold the market up from rising further. However, the bullish turnaround last week could now also ignite further upside momentum causing a break of that important level. A test of the all- time- high at around USD 4,800.00 might then be the case.
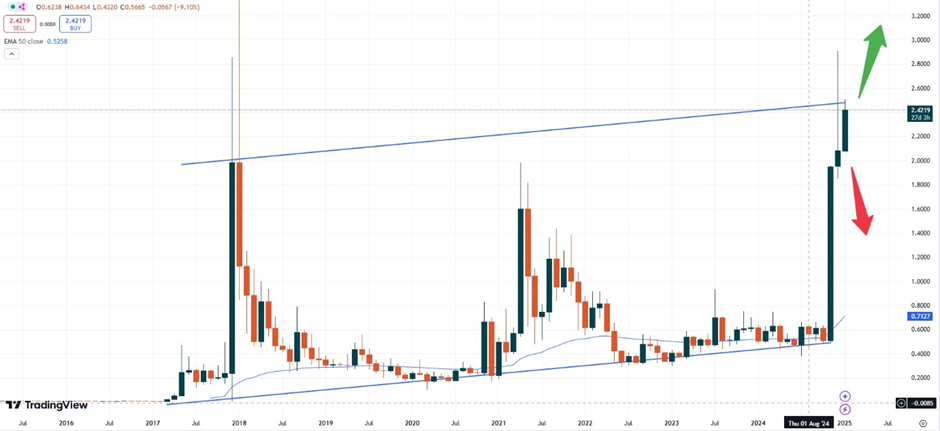
– XRP: XRP is currently trading at USD 2.4300 and continues to creep higher. The monthly chart might only offer limited upside until the tip of the recent pinbar candlestick from the month of December.
As the resistance trendline shows, momentum might still be limited towards the USD 2.5000 area, where also the rising resistance trendline in blue colour can be found. The price might then proceed to lower levels based on the general overall trend.
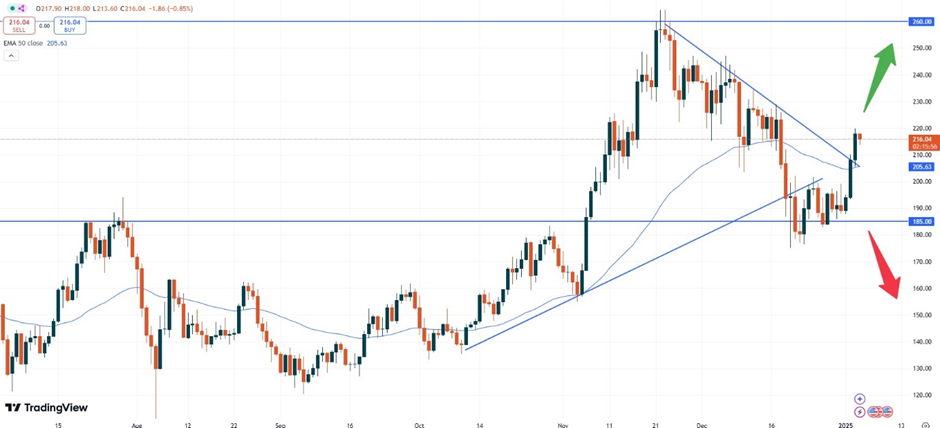
– SOL: Solana is currently trading at USD 216.30 and has also been able to move to higher levels at the start in 2025. The daily chart currently suggests that the upside might continue. The recent break of the 50 -moving average based on the daily chart might now open up momentum to higher levels.
The upside might now see the price testing the technical resistance level pf USD 260.00. A break of that level might then offer further momentum towards higher prices.
Vantage does not represent or warrant that the material provided here is accurate, current, or complete, and therefore should not be relied upon as such. The information provided here, whether from a third party or not, is not to be considered as a recommendation; or an offer to buy or sell; or the solicitation of an offer to buy or sell any financial instruments; or to participate in any specific trading strategy. Any research provided does not have regard to the specific investment objectives, financial situation and needs of any specific person who may receive it. We advise any readers of this content to seek their own advice. Without the approval of Vantage, reproduction or redistribution of this information is not permitted.