Fresh tariffs imposed over Mexico and Canada might also cause harm for the crypto market. Last week on Thursday, President Trump stated that the 25% price increases would begin on the 1t of February. Prior to the news prices for Bitcoin went lower and also stock markets were negatively affected. Furthermore 10% tariffs would be added on imports coming from China. The market sentiment has shifted now into cautious territory in general.
Technical analysis:
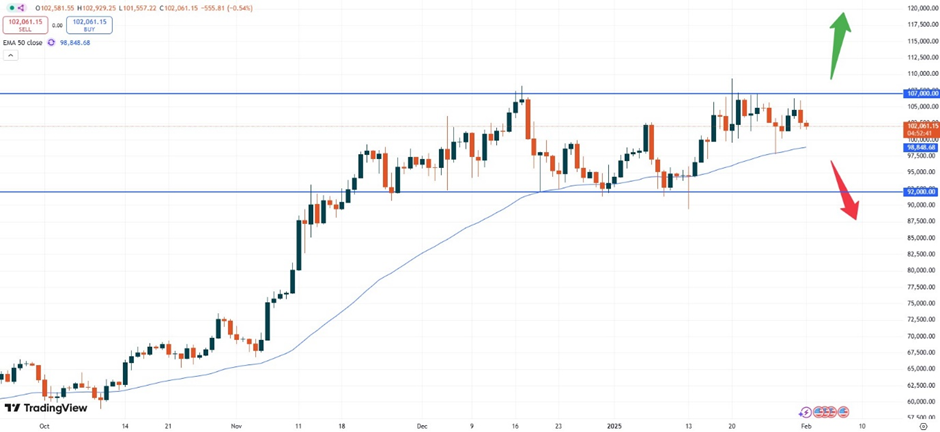
– BTC: Bitcoin is trading at USD 102,050. Last week did not end positive for Bitcoin as the market seems to face further profit taking ahead. Recent news also seem to cause an impact here and might cause Bitcoin to tumble further.
The daily chart above shows, that the sideways price pattern seems to continue, whereas only a strong breakout above the USD 107,000 level would open up the market for further positive momentum. The rising 50- moving average currently sitting just below the USD 100,000 level might act as initial support if the current downside will intensify.
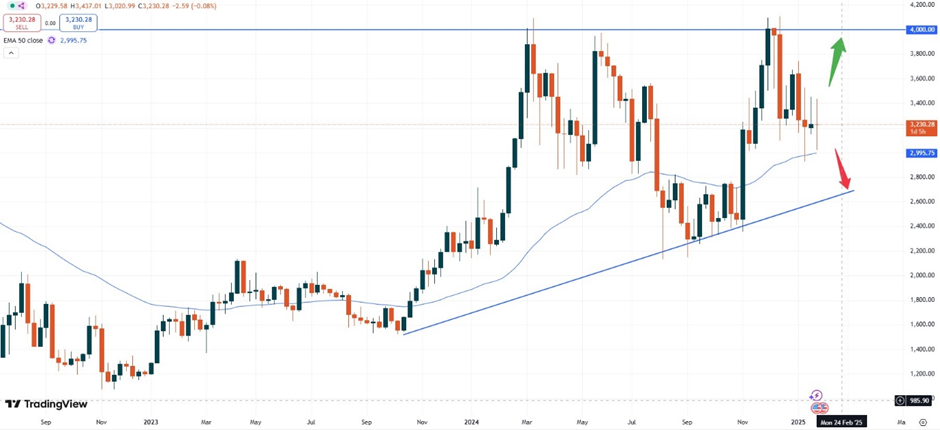
– ETH: Ethereum is currently trading at USD 3,231.00. Last week, Ether was also not able to rise again and instead continued its sideways price action trend. The market seems to be well supported at lower levels but also the upside does not happen for now.
The weekly chart shows that the price keeps trading away of the 50 -moving average still with yet no motivation to run higher. A break above the USD 4,000.00 zone is needed for fresh upside, as this level marks the strong technical resistance zone.
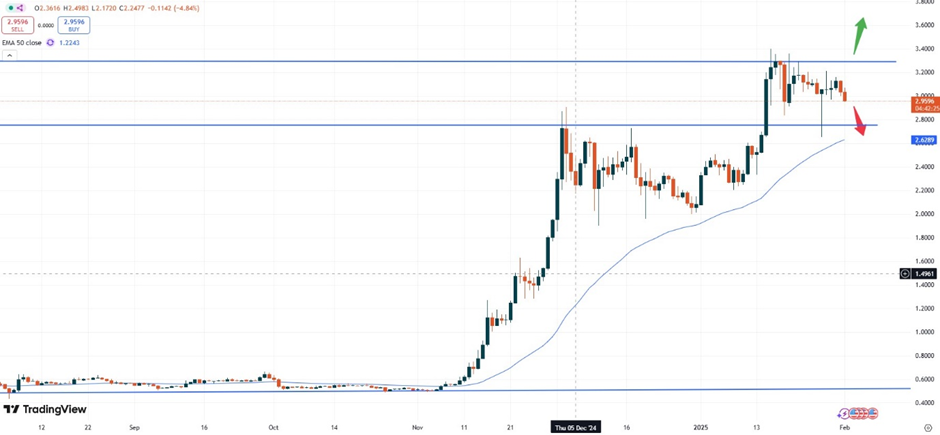
– XRP: XRP is currently trading at USD 2.9500 and with that has fallen back below the psychological resistance zone of USD 3.0000. Currently the daily chart shows that the market might continue to trade in this flag- style trend. However, only a break above the zone of USD 3.3500 would qualify for further positive momentum again.
Looking back to the previous correction, which started on the 02nd of December last year, this corrective pattern lasted quite some time, until the breakout happened on the 15th on January. Should this correction last, a push higher might start off the area at USD 2.7500.
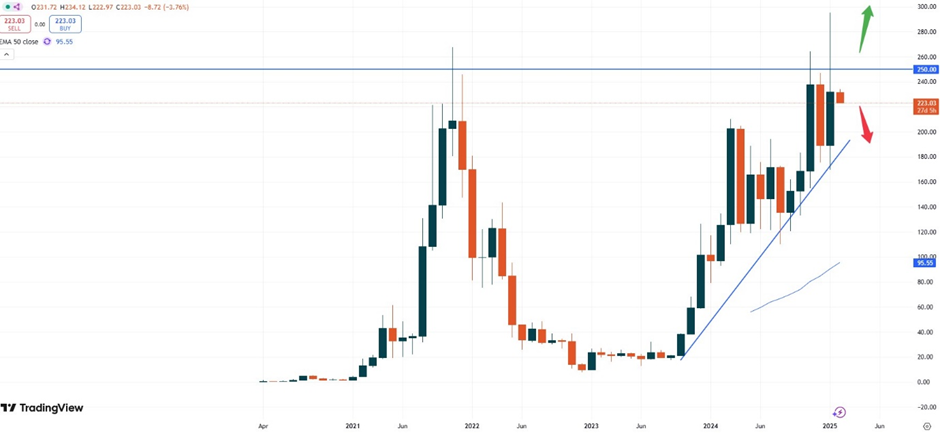
– SOL: Solana is currently trading at USD 221.90. Also, Solana has not been able to continue with the recent breakout to the upside. Instead, the market corrected as well and might now show a further correction being underway.
The monthly chart shows, that the price is breaking away further from the important resistance zone of USD 250.00. This area needs to be cleared to unleash further upside in this market. Else a retest of the rising trendline might occur first.
Vantage does not represent or warrant that the material provided here is accurate, current, or complete, and therefore should not be relied upon as such. The information provided here, whether from a third party or not, is not to be considered as a recommendation; or an offer to buy or sell; or the solicitation of an offer to buy or sell any financial instruments; or to participate in any specific trading strategy. Any research provided does not have regard to the specific investment objectives, financial situation and needs of any specific person who may receive it. We advise any readers of this content to seek their own advice. Without the approval of Vantage, reproduction or redistribution of this information is not permitted.