According to coindesk.com the US crypto industry might face positive momentum moving forward. The SEC – Securities and Exchange Commission is looking for ways to better apply securities laws to the sector, which had been announced after their first gathering on crypto issues. In particular NFTs might also face interesting times ahead as they will be discussed during the next staff meeting. Since Trump took office the crypto space has gotten positive momentum from legislators. This might support this market medium- term. For now, markets remain shaky as bulls and bears continue to fight. Clear price action of the NASDAQ should be taken as a guidance for further moves.
Technical Analysis:
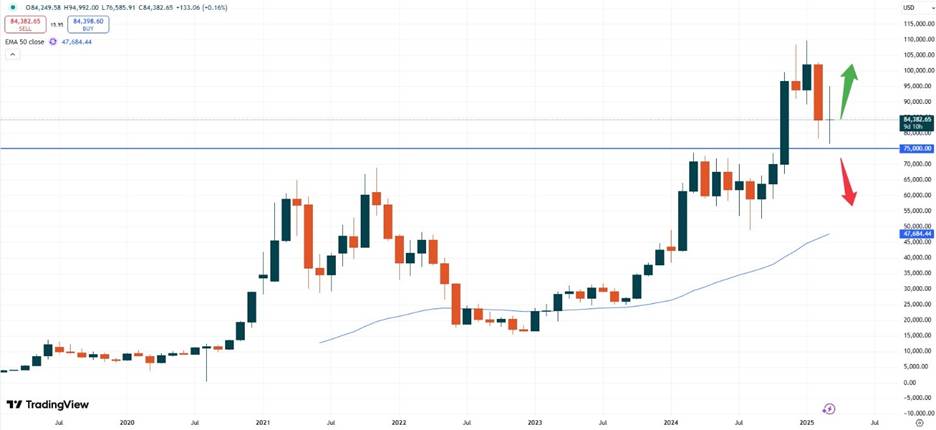
BTC – Bitcoin is trading at USD 84,380. The market remains in a sideways pattern and might show volatile times in both directions. While short term some positive momentum in Bitcoin might occur, medium term the downside risk still remains imminent. Following the Nasdaq index with more than 70% accuracy any slide in the equity sector might also cause the crypto market to weaken.
The above monthly chart shows, that the price has not been able to break the resistance all- time- high above the USD 100,000 level. Instead, the market remains capped below and might first slide towards the USD 75,000 zone. If that zone holds, another attempt to the upside might be expected.
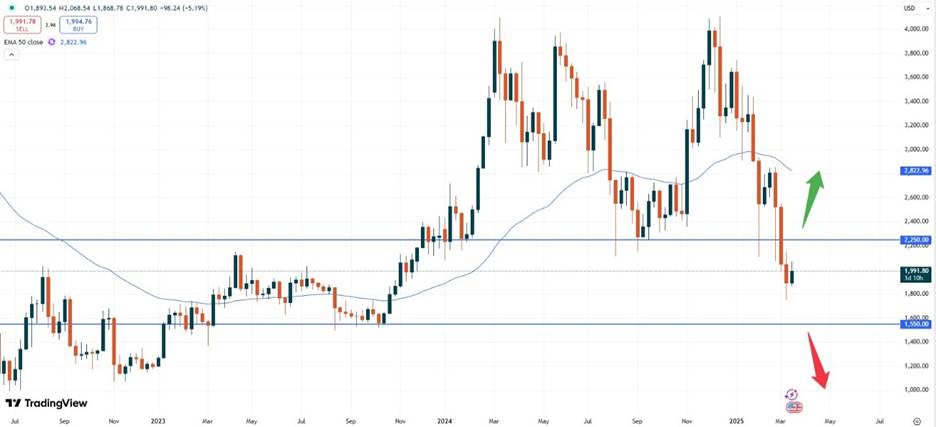
ETH – Ethereum is currently trading at USD 1,991,00. With the slide below the psychological USD 2,000.00 level more downside might occur. Should the market break away from the current sideways zone in between the blue trendlines an attempt into either direction might be seen.
Currently, rather sliding prices look feasible, whereas falling prices towards the USD 1,200.00 area should be factored in. A buy the dip strategy might offer long-term access in this market.
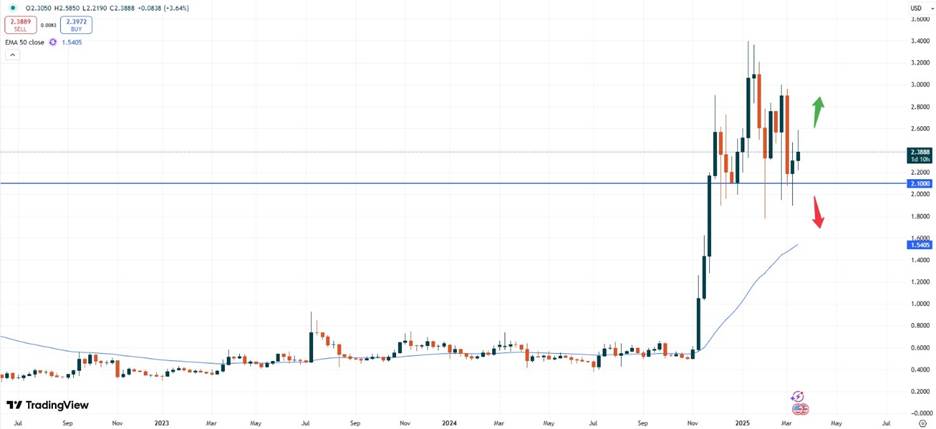
XRP – Ripple is currently trading at USD 2.3880. Also Ripple remains inside the sideways trending channel without any attempt to breakout for now. Looking at the long-term moves another attempt to lower prices might be likely.
From a technical point of view the upside seems limited and we might see a head and shoulders pattern currently being formed. The upside might hence be capped at around the USD 2.9000 level. On the downside a decline below the USD 2.1000 zone might cause the market to fall back towards previous levels below USD 1.0000.
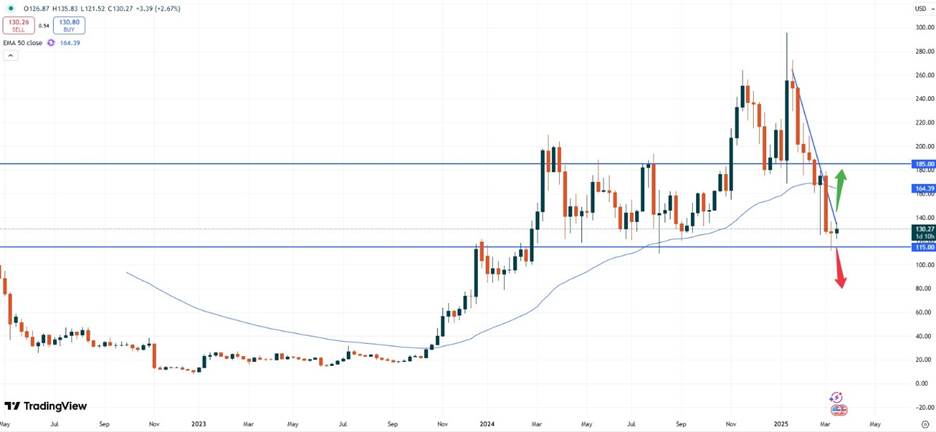
SOL – Solana is currently trading at USD 130.16. This market looks positive for now and might indeed attempt another run to the upside. The weekly chart reveals that the support zone at USD 120.00 might continue to hold.
In this case, the price could continue to rise from here and move towards the next important resistance zone at USD 185.00. A milestone might also be the break of the 50- moving average trendline, which currently sits at USD 165.00.
Vantage does not represent or warrant that the material provided here is accurate, current, or complete, and therefore should not be relied upon as such. The information provided here, whether from a third party or not, is not to be considered as a recommendation; or an offer to buy or sell; or the solicitation of an offer to buy or sell any financial instruments; or to participate in any specific trading strategy. Any research provided does not have regard to the specific investment objectives, financial situation and needs of any specific person who may receive it. We advise any readers of this content to seek their own advice. Without the approval of Vantage, reproduction or redistribution of this information is not permitted.