After the fresh slide in US stocks, in particular from the tech sector, it seems that also the crypto market follows up with the bearish sentiment. Towards the end of last week most tokens resumed trading with downside momentum, which might escalate further.
The difference in risky assets can now be seen. While investors consider where to park their money currently it seems that Gold keeps shining even more. A reason for the difference seems to be the general macro view. Worries about growth in the US economy weighs negatively on markets, whereas also this time altcoins have lost more momentum as compared to Bitcoin. The implementation of new tariffs starting this week and last week’s stronger that expected PCE inflation data will add some burden as well.
Technical Analysis:
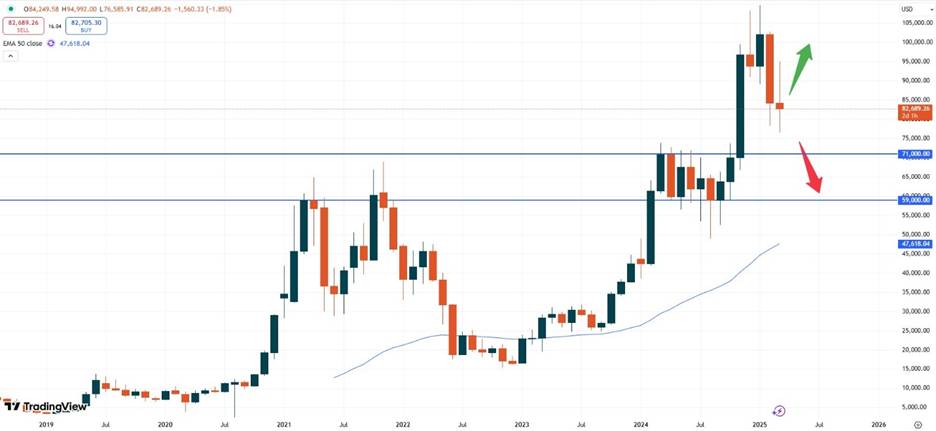
BTC – Bitcoin is trading at USD 82,524. Based on the long-term monthly chart, the price does not seem to be ready to break the recently created all- time high. Instead, traders might be better off checking out recent resistance zones, as they could act as new support areas.
BTCUSD, monthly chart
The monthly chart above shows, that upcoming support areas will be found at USD 71,000 as well as USD 59,000 below that area. While the first days of April might offer slight upside momentum initially, the general trend looks bearish.
ETH – Ethereum is currently trading at USD 1,991. Despite the market not trading with high volatility, falling prices can also be observed here. With the break of the USD 2,000 zone another psychological support area has been broken. This move might now also unleash more downside momentum.
ETHUSD, weekly chart
The weekly chart above shows, that the momentum might now increase towards the USD 1,550 support area.
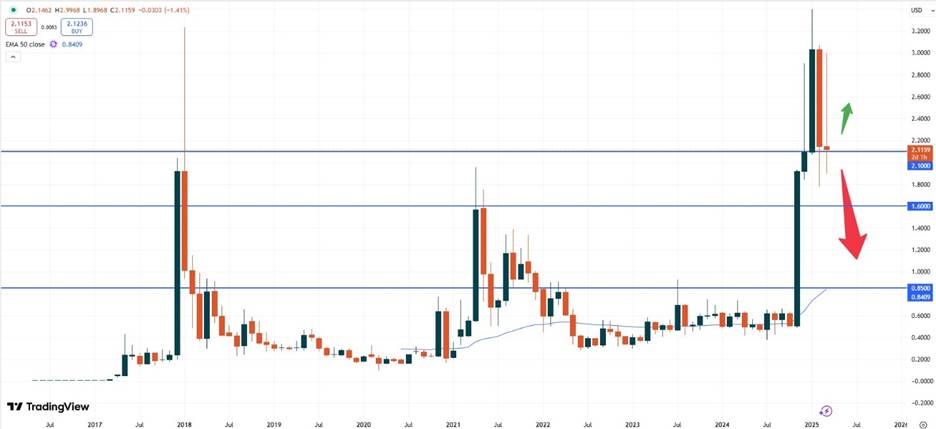
XRP – Ripple is currently trading at USD 2.1185. A check with the long-term monthly chart reveals that the market also seems on track with further downside potential. With the monthly candlestick pattern guiding market participants heading into April, the negative sentiment might be set to continue as well.
XRPUSD, monthly chart
For now, sliding prices should also be factored in. Any break of the area at USD 2.1000 might be used for fresh selling opportunities. While a bounce higher might happen, this could only be of short- term nature.
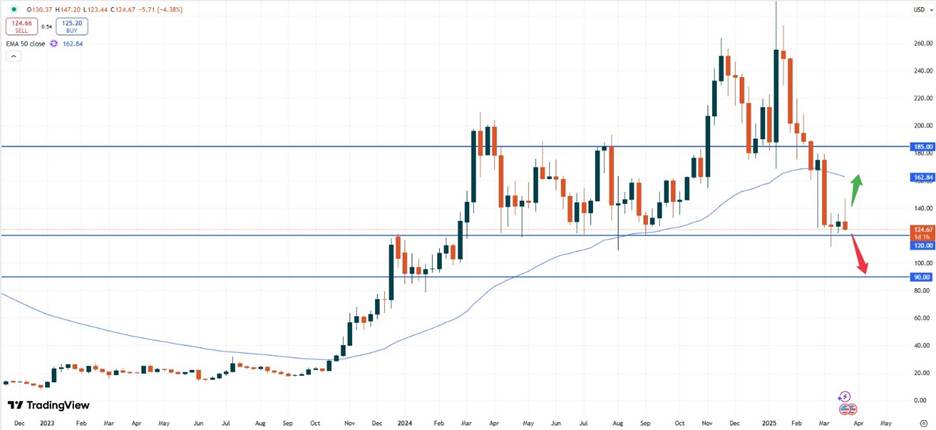
SOL – Solana is currently trading at USD 124.79. The slide in this token also continues as the market has broken the supportive 50- moving average quite some time ago. The market now seems to be on track to test the upcoming support zone of USD 120.00.
SOLUSD, weekly chart
As the weekly chart above shows, a break of that USD 120.00 area might add fresh selling pressure towards the USD 90.00 zone. In between, also the psychological price at USD 100.00 could act as support but might give way, too.
Vantage does not represent or warrant that the material provided here is accurate, current, or complete, and therefore should not be relied upon as such. The information provided here, whether from a third party or not, is not to be considered as a recommendation; or an offer to buy or sell; or the solicitation of an offer to buy or sell any financial instruments; or to participate in any specific trading strategy. Any research provided does not have regard to the specific investment objectives, financial situation and needs of any specific person who may receive it. We advise any readers of this content to seek their own advice. Without the approval of Vantage, reproduction or redistribution of this information is not permitted.