Last week gave a remarkable performance of most tokens. Despite huge losses in the stock markets led by US technology stocks, the crypto market was extremely resilient. After Donald Trump’s announcements of reciprocal tariffs US equities hat lost USD 5.4 trillion in value in the following two days. In particular the NASDAQ corrected sharply. Bitcoin, however, only fell 6%, marking slightly more than half of the losses compared to the 11% drawdown in the Nasdaq.
According to statements of UK banking giant Standard Chartered Bitcoin would now mark a hedge against instability in the financial sector. Any positive return in the equity sector might then cause the crypto market to move higher again.
Technical analysis:
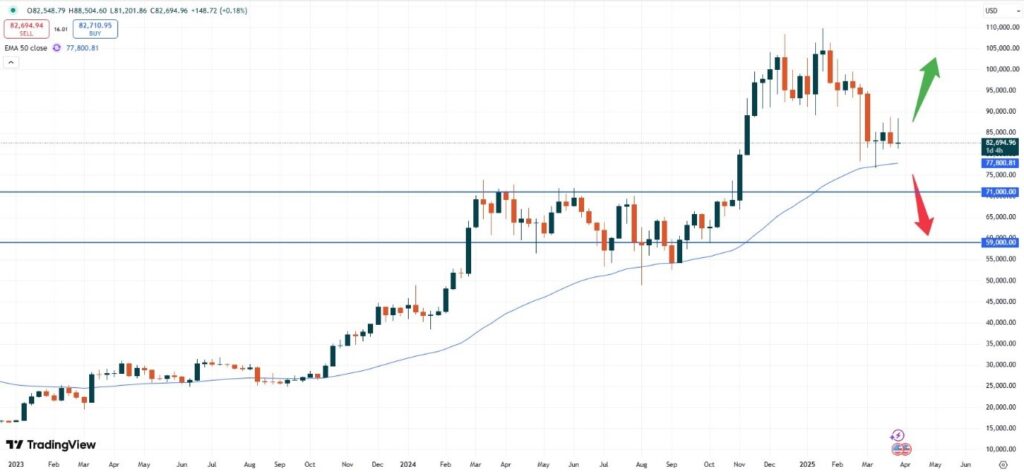
– BTC: Bitcoin is trading at USD 82,676. As discussed above, the price of Bitcoin also fell after a slight attempt of recovery last week yet stabilized above the USD 80,000 support zone. Looking at the weekly candlestick pattern the market might still be ready to proceed lower.
BTCUSD, weekly chart
The next line of support might be found with the 50- moving average trendline at around the USD 77,800 area. Furthermore, an important support zone could also be seen at USD 71,000, the previous resistance area about one year ago. Positive momentum might only be found if the market can clear the technical resistance zone at USD 87,800.
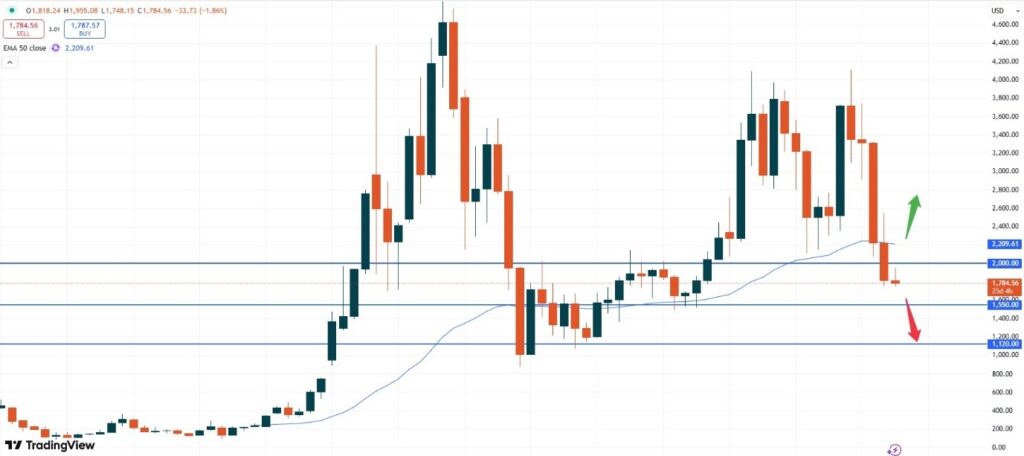
– ETH: Ethereum is currently trading at USD 1,784. Based on the monthly chart the market has not been able to trade above the important 50- moving average towards the end of March. With that move falling market sentiment might hence be found in the coming weeks.
ETHUSD, monthly chart
On the other hand, we can also observe that after a strong slide the market has also been able to gear up steam in the following weeks thereafter. This can be observed in June 2022, where the market was then eventually able to rise above that 50- moving average level again. Without any recovery, though, the market might still be able to fall towards the USD 1,120 zone.
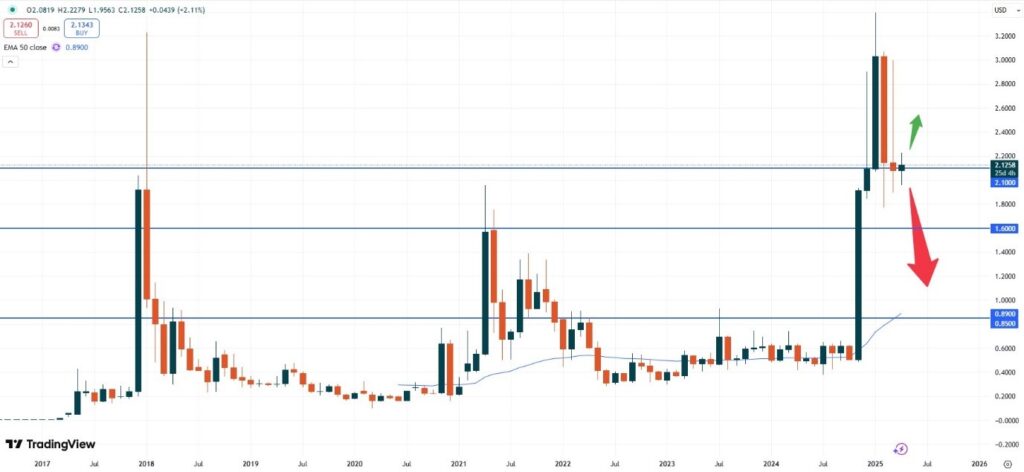
– XRP: XRP is currently trading at USD 2.1258. Since last month ended in a bearish manner, as we anticipated before, the price might now continue with its slide to lower levels.
XRPUSD, monthly chart
The extreme high point from January this year continues to guide the market. Any recovery in the coming days ahead this month could hence be a sign that downside momentum might resume fresh speed. The general trend might depend on the overall risk sentiment in markets, where Ripple looks prone for further profit taking.
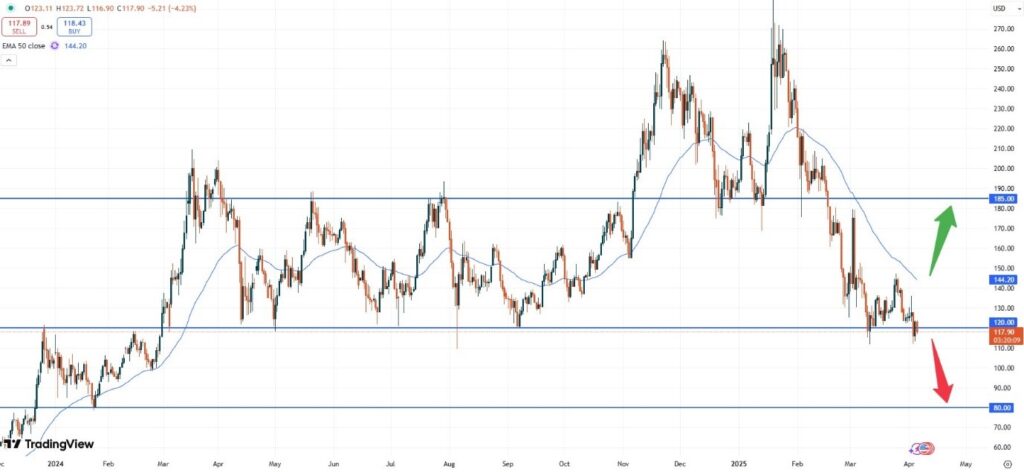
– SOL: Solana is currently trading at USD 117.88 and continue to remain in a negative trend. As the market keeps trading below the 50- moving average area, which keeps acting as a resistance zone, more downside momentum might occur.
SOLUSD, daily chart
Since also the USD 120.00 support zone has been broken, downside momentum could be found towards the USD 80.00 level. A recovery might only be seen if the market breaks the important 50- moving average to the upside.
Vantage does not represent or warrant that the material provided here is accurate, current, or complete, and therefore should not be relied upon as such. The information provided here, whether from a third party or not, is not to be considered as a recommendation; or an offer to buy or sell; or the solicitation of an offer to buy or sell any financial instruments; or to participate in any specific trading strategy. Any research provided does not have regard to the specific investment objectives, financial situation and needs of any specific person who may receive it. We advise any readers of this content to seek their own advice. Without the approval of Vantage, reproduction or redistribution of this information is not permitted.