Crypto markets have taken a toll after the freshly added tariffs by US President Trump last week. Most tokens, however, were able to remain solid holding up nicely against the losses in particular against US equities. However, recent sentiment caused upside momentum and alongside the general equity sector further positive momentum might be on the cards.
In the end Donald Trump stated that tariffs for most countries would be delayed by 90 days, which added fresh buying power not only for the equity sector but also the crypto space.
Technical analysis:
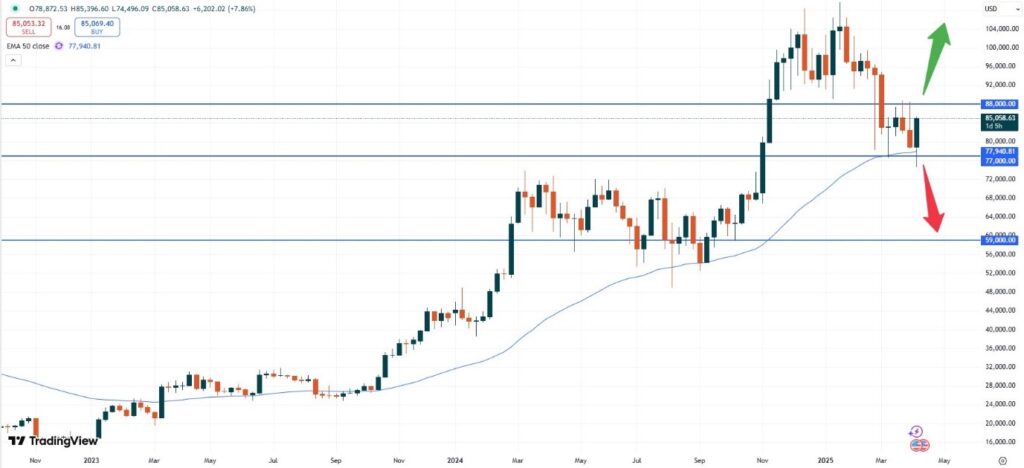
– BTC: Bitcoin is trading at USD 84,980. After the recent slide in equities also Bitcoin has been able to recover some ground. Based on the weekly chart, the market has been able to rise off the 50- moving average zone. This area acted as a strong support zone in the past and might now also help to cause the market pushing higher.
BTCUSD, weekly chart
If the mentioned support area does not break, more upside momentum might be seen. In particular a break of the important technical resistance zone at USD 88,000 should be observed. The market might then start to test higher levels above the SUD 100,000 price mark.
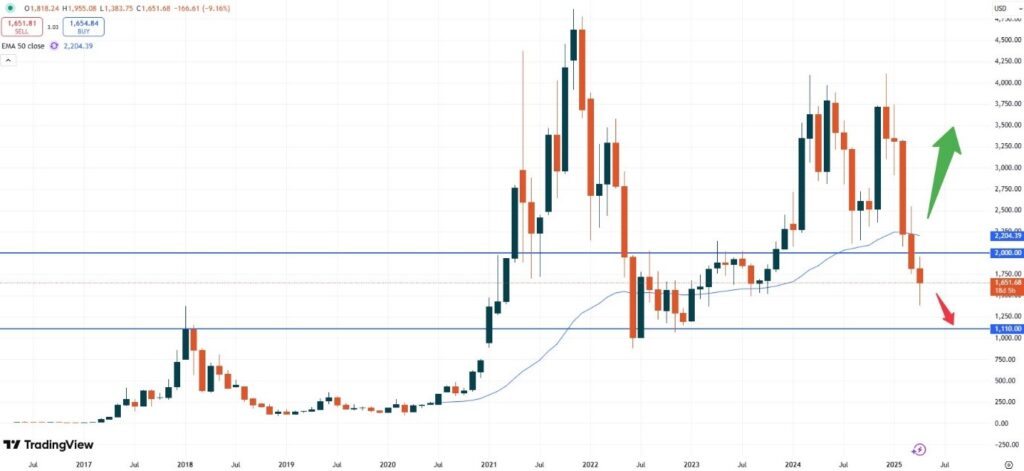
– ETH: Ethereum is currently trading at USD 1,650. Compared to Bitcoin the biggest Altcoin by market capitalization remains capped under the 50- moving average based on the monthly chart.
ETHUSD, monthly chart
The price has recently fallen substantially and looks like further headwinds might be around the corner. On the other hand, a break below the 50- moving average in the past was often recovered swiftly, which might help this market to also recover quickly. Especially the continuation of the positive risk sentiment might help here.
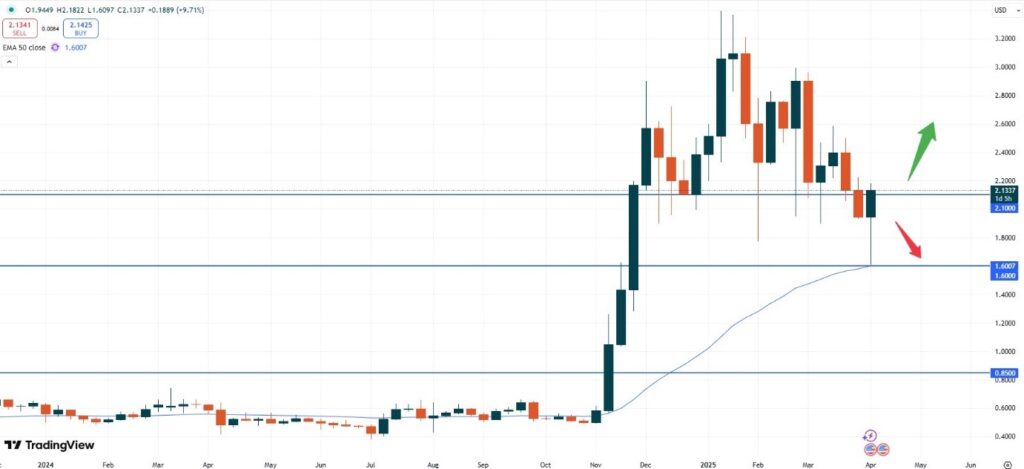
– XRP: Ripple is trading at USD 2.1339. This token in particular looks like the positive sentiment returning to markets will remain of utmost help. To push prices higher. A break of the psychological resistance zone at 2.2000 could unleash further upside momentum.
XRPUSD, weekly chart
On the other hand, a break of the 50- moving average support zone will cause prices to fall even further. The bottom might only then wait below the 1.0000 level.
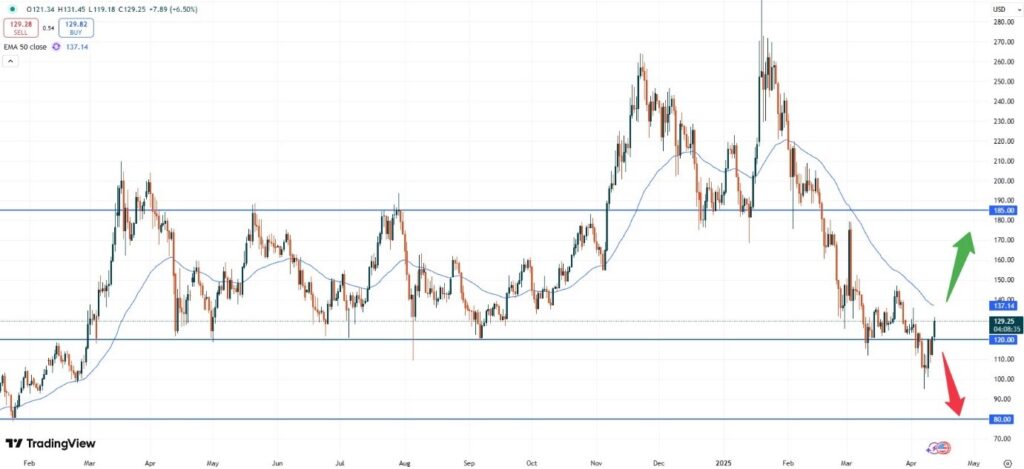
– SOL: Solana is trading at USD 129.29. After the recent fall also this token has been able to build a strong support area. Having tested the psychological 100.00 level prices stopped falling being able to celebrate a strong recovery.
SOLUSD, daily chart
Yet the market seems to be capped by the 50- moving average for now. The falling trend currently comes into play at about 140.00. A break of this zone might then unleash fresh buying momentum towards the 185.00 level.
Vantage does not represent or warrant that the material provided here is accurate, current, or complete, and therefore should not be relied upon as such. The information provided here, whether from a third party or not, is not to be considered as a recommendation; or an offer to buy or sell; or the solicitation of an offer to buy or sell any financial instruments; or to participate in any specific trading strategy. Any research provided does not have regard to the specific investment objectives, financial situation and needs of any specific person who may receive it. We advise any readers of this content to seek their own advice. Without the approval of Vantage, reproduction or redistribution of this information is not permitted.