The crypto space has been trading in a positive pattern as equity markets remain positive. Upside momentum might still be a reason why Bitcoin in particular continues to trade higher. The weaker Dollar might also help such moves. Furthermore, the rising Gold price might be interesting to observe as market observers also claim that Bitcoin is at least taking over some momentum of the shining metal.
However, according to CryptoQuant fresh price swings might happen. The so- called “mid-term” holders, with an average holding period between 3 – 12 months might cause a fresh spike in volatility in markets as historical data shows. As they tend to be more reactive to market conditions compared to long-term holders, yet less impulsive on- chain data suggest such moves. Growing uncertainty has been anticipated ahead of an anticipated market event.
Technical analysis:
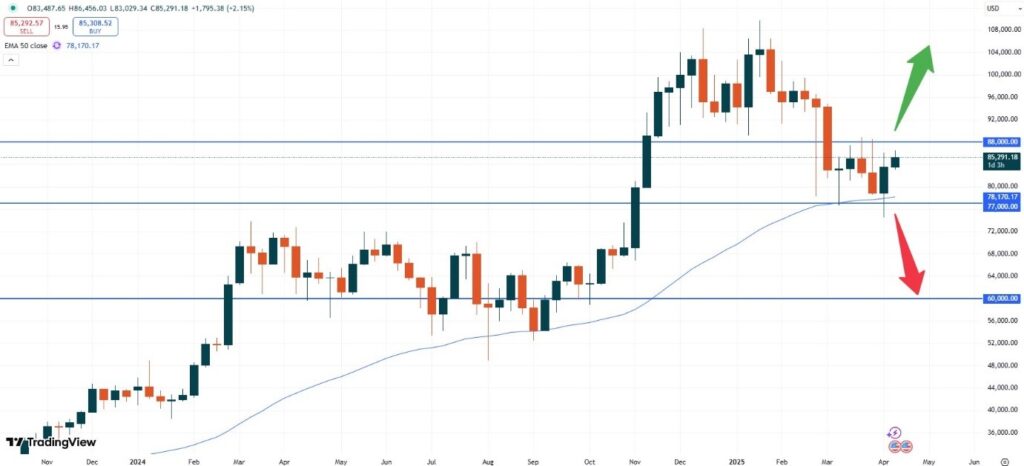
– BTC: Bitcoin is trading at USD 85,282. Since the market remained in a sideways pattern not much upside has been observed. Despite the negative sentiment as outlined above the general trend looks positive again. A break of the USD 88,000 level might indicate fresh upside momentum. The 100,000 would then come into play again.
BTCUSD, weekly chart
As the chart above shows the recent candlestick pattern based on the weekly chart still remains intact. As long as the 50- moving average won’t break, upside momentum might be seen.
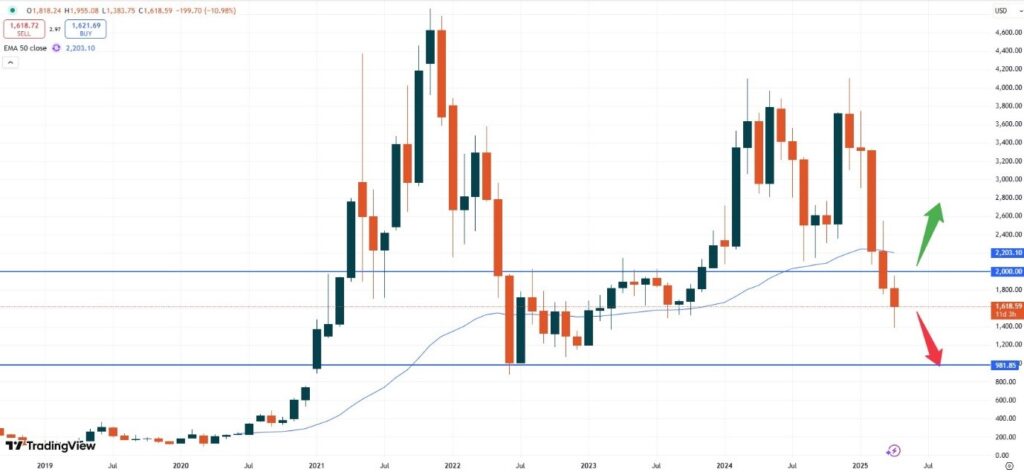
– ETH: Ethereum is trading at USD 1,619. Based on previous discussions the market seems to continue its negative sentiment as the price of Bitcoin continues to rise. Another issue might also be found based on the monthly chart below. The Price has still not been able to break above the 50- moving average. This strong resistance might continue to cause the market to push lower for now.
ETHUSD, monthly chart
The downside momentum might still cause prices to fall towards the USD 1,000 zone.
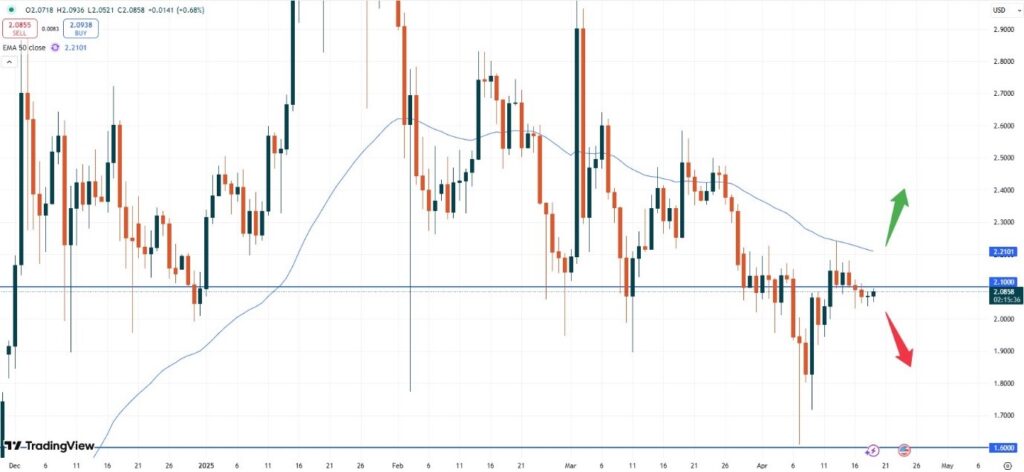
– XRP: Ripple is trading at USD 2.0857. The recent falling price sentiment has seemingly found a bottom with the market being potentially ready to push higher again. As prices from earlier this month show, the USD 2.0000 able has been regained again. If the market is now able to also break the important 50- moving average resistance zone more upside momentum might be seen.
XRPUSD, daily chart
Any break of the important zone at USD 2.2100 might unleash fresh upside momentum.
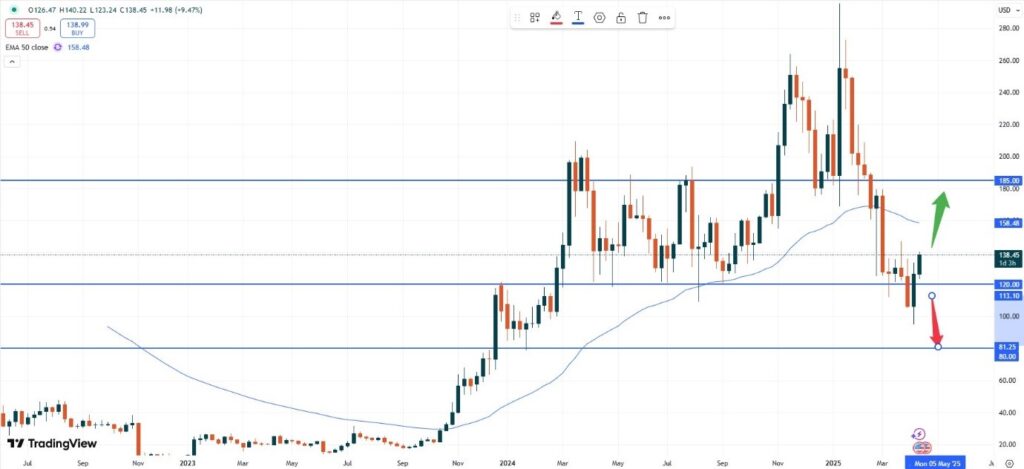
– SOL: Solana is trading at USD 138.39. Similarly to Bitcoin also this market has been able to push higher.
SOLUSD, weekly chart
If the important psychological resistance zone at USD 120.00 will last, more upside momentum can be seen. Further, a break of the important 50- moving average zone might also help the upside momentum to gear up speed.
Vantage does not represent or warrant that the material provided here is accurate, current, or complete, and therefore should not be relied upon as such. The information provided here, whether from a third party or not, is not to be considered as a recommendation; or an offer to buy or sell; or the solicitation of an offer to buy or sell any financial instruments; or to participate in any specific trading strategy. Any research provided does not have regard to the specific investment objectives, financial situation and needs of any specific person who may receive it. We advise any readers of this content to seek their own advice. Without the approval of Vantage, reproduction or redistribution of this information is not permitted.