Traders continue to take profits in crypto markets and hence the downside momentum is expected to continue. The fear and greed index has been falling by 5 points and is currently sitting at 49 in a “neutral” zone. Geopolitical tensions also cause setbacks in the crypto space. Should the issue between Iran and Israel continue to escalate, markets might fall further.
The Nasdaq index has been trading weaker last week, which acts as a good barometer for most tokens. However, some analysts still expect Bitcoin to act as a safe haven, and hence might cause this token to rise to new highs anytime soon.
Technical Analysis:
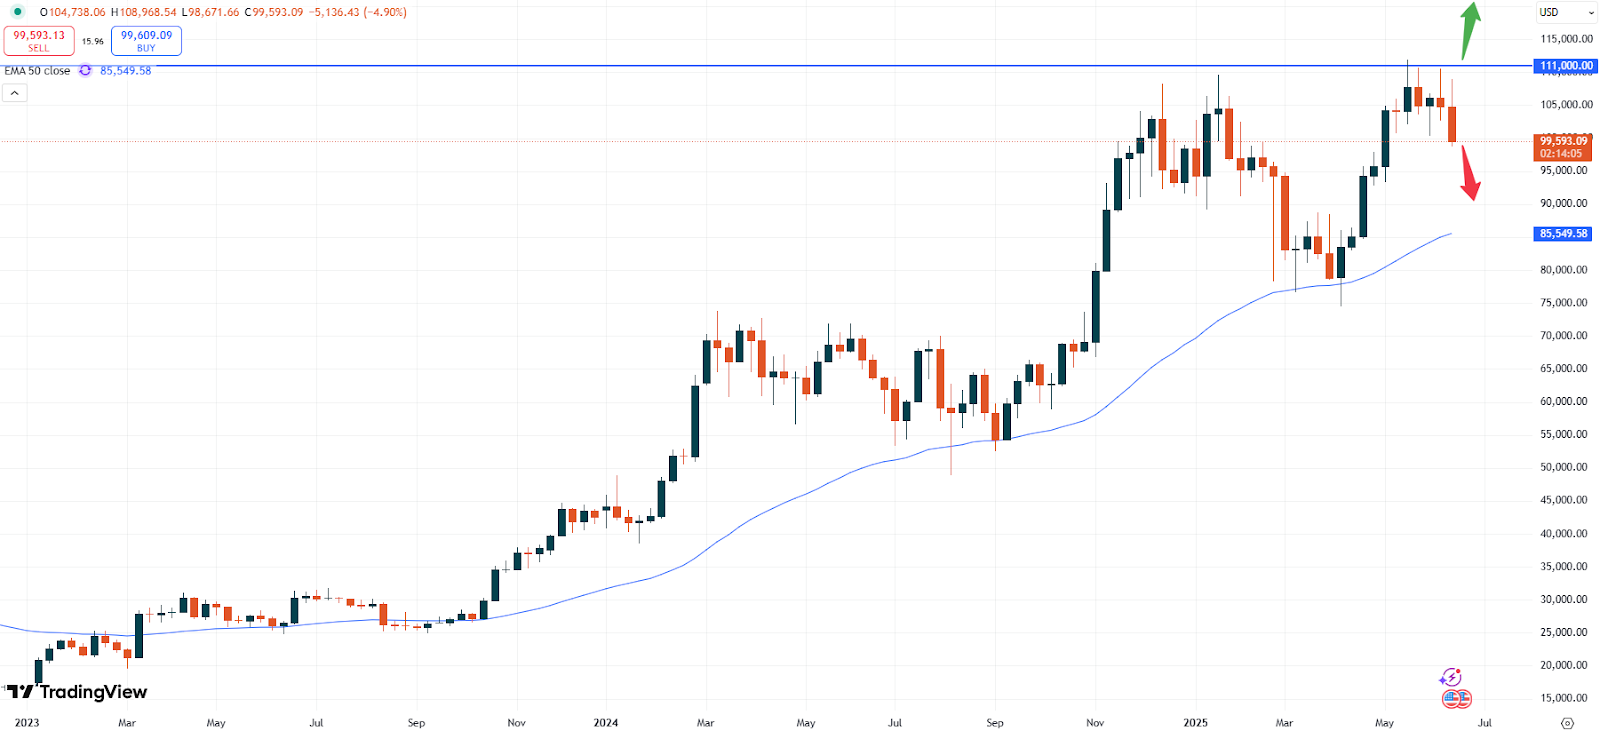
BTC – Bitcoin is trading at USD 99,593. The market continues to be impacted by some strength of the Dollar as well as the above-mentioned issues. Downside momentum might now be the case before the upside might continue.
BTCUSD weekly chart
As the chart above shows, prices remain in a strong trend to the upside but have stopped rising. The correction is expected to continue for now. The wigs in recent candles show that rising prices have always been capped. Each attempt to push higher was in the end sold again. Below the USD 100,000 level the negative sentiment might increase again.
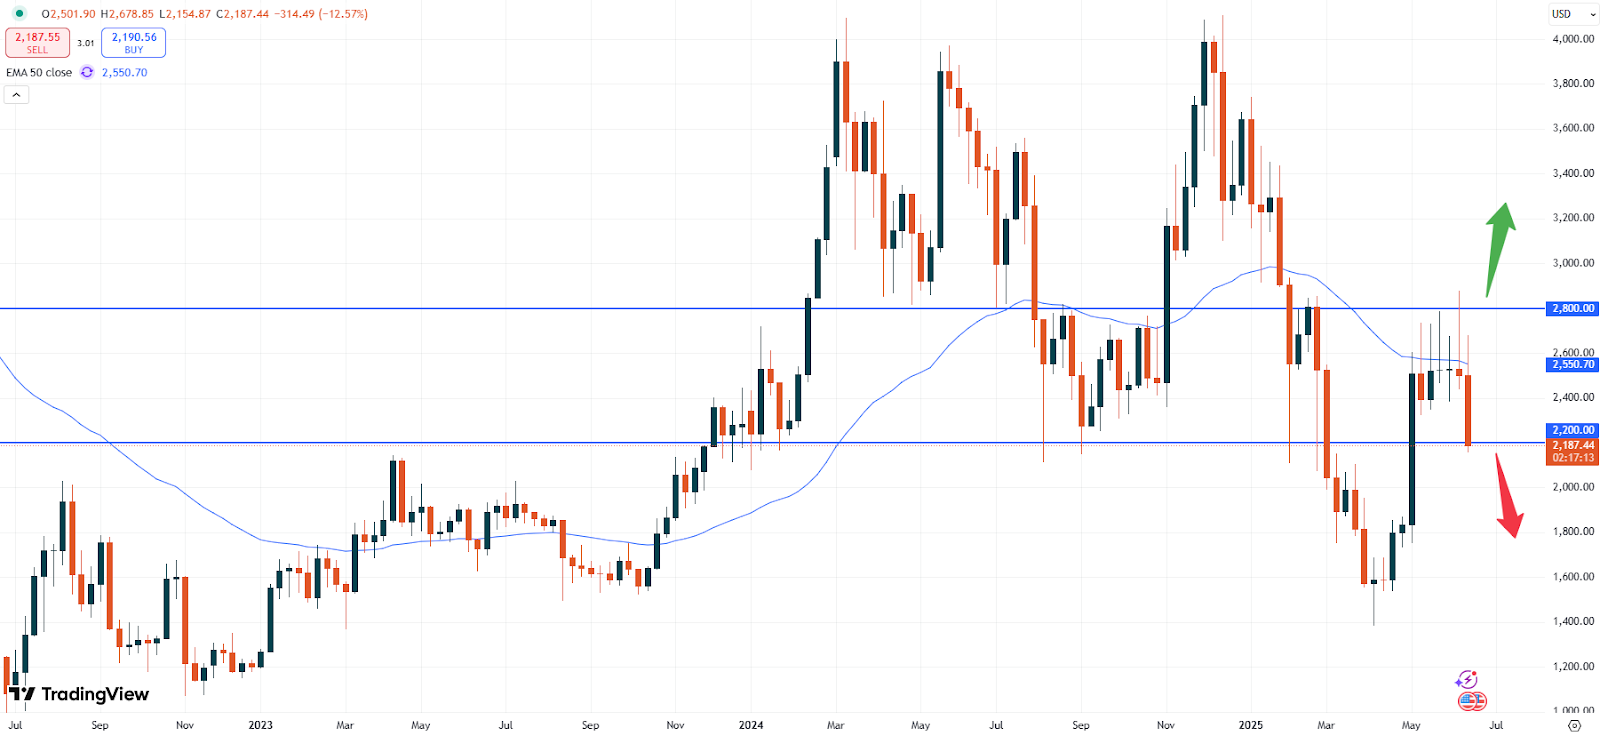
ETH – Ethereum is currently trading at USD 2,187. Similarly to Bitcoin also ETH is looing set to weaken further for now. The generally bullish looking chart on the monthly basis is currently fading and prices might break below the 50- moving average again.
ETHUSD weekly chart
The same can be observed on the weekly chart as well. Currently prices are also trading below the 50- moving average, which will suggest a retest of the USD 2,200 zone. That support zone based on the long- term chart will then determine the future move.
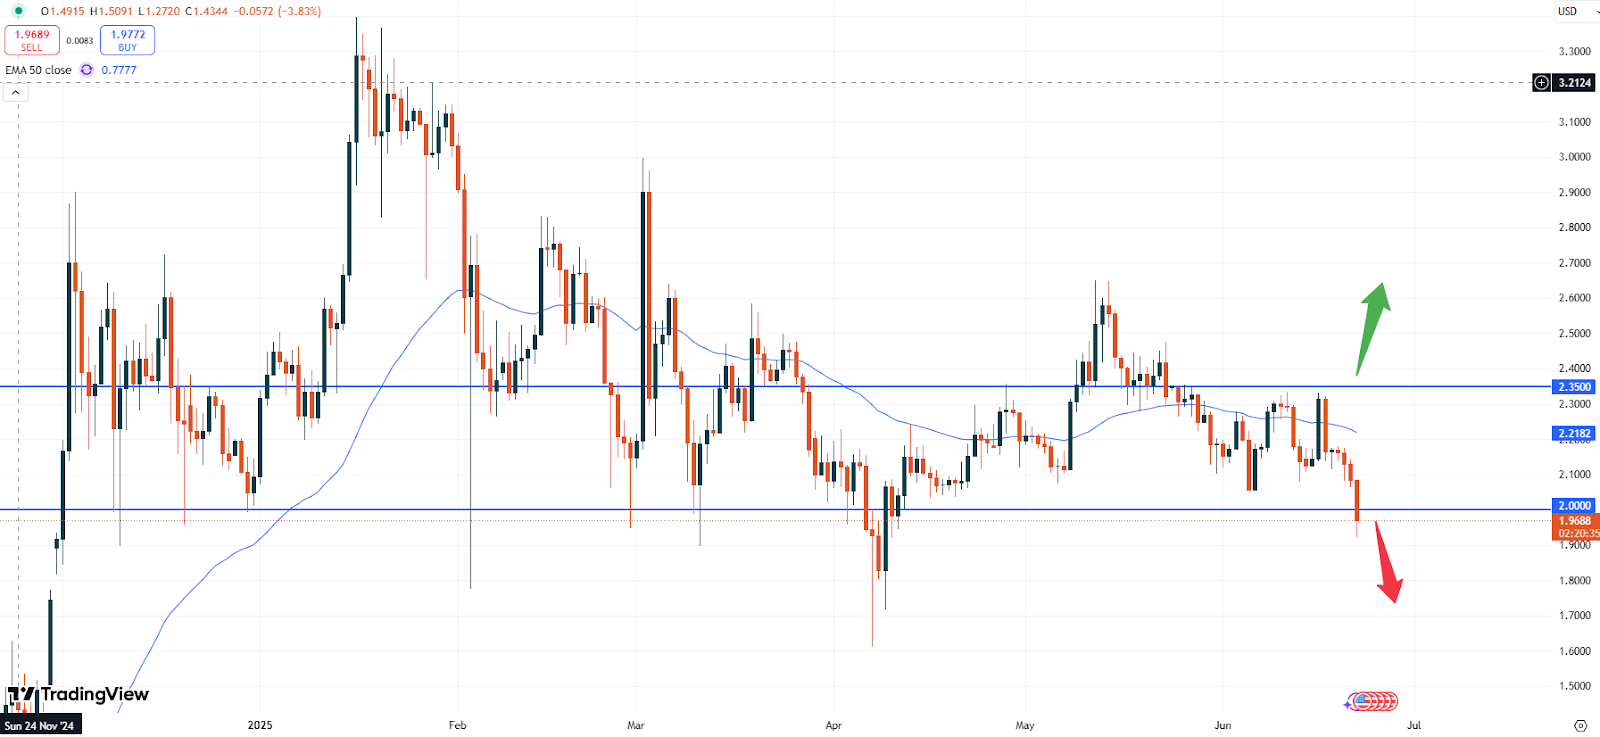
XRP – Ripple is currently trading at USD 1.9688 The price remains capped below the 50- moving average based on the daily chart. A fall back towards a lower price range should be expected currently.
XRPUSD daily chart
However, the daily chart above also shows that the negative sentiment might change direction and could push the market back to the upside. Above the USD 2.3500 zone the positive momentum might then intensify.
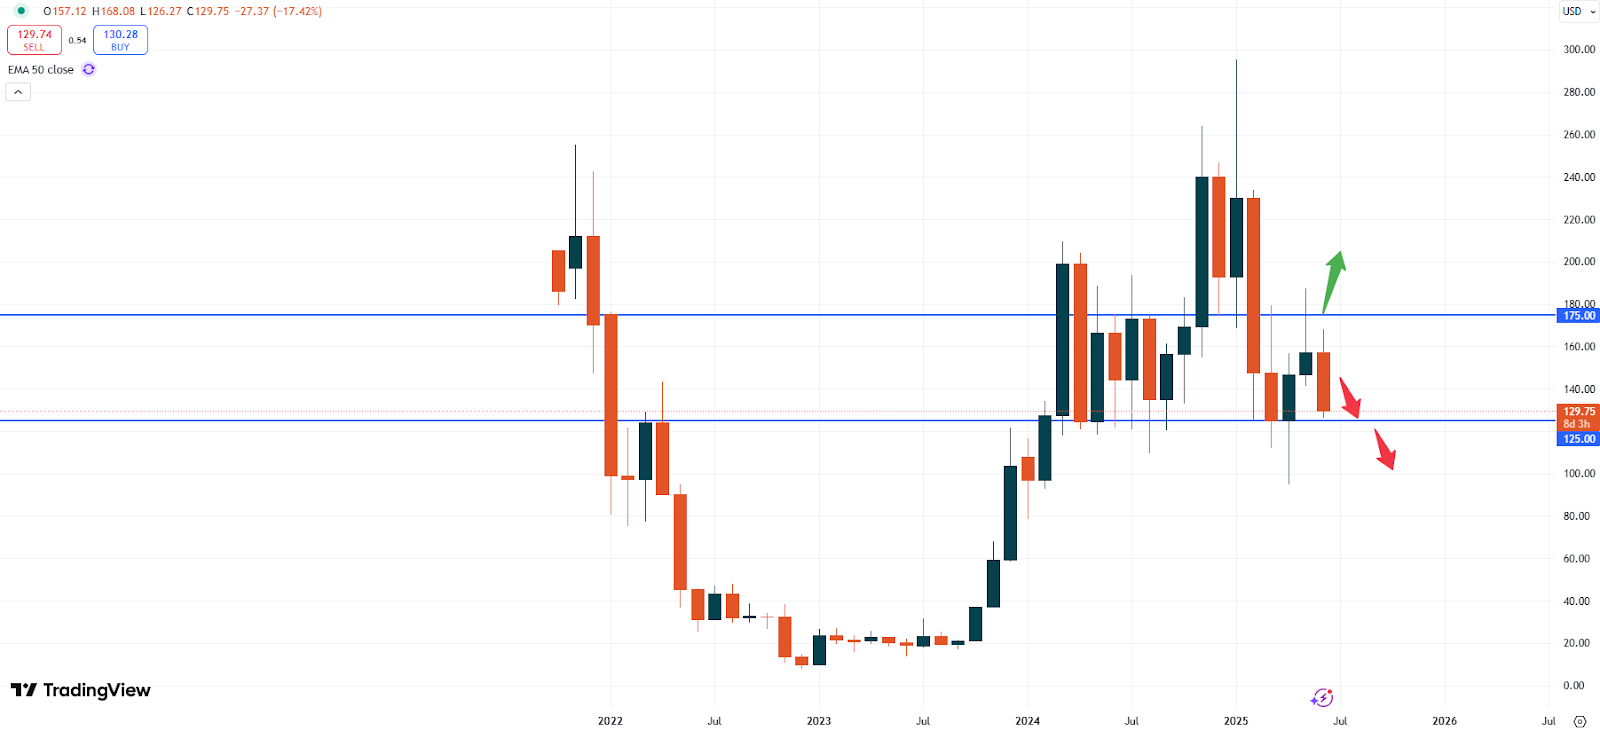
SOL – Solana is currently trading at USD 129.75. Following the long- term charts more downside momentum might currently emerge. Solana has been capped with the technical pinbar candlestick pattern based on the monthly chart.
SOLUSD monthly chart
As the situation is not expected to change for now, traders should expect more downside momentum for now. Positive sentiment might only occur, if the USD 175.00 level will be regained. Until then bearish momentum could also intensify.
Vantage does not represent or warrant that the material provided here is accurate, current, or complete, and therefore should not be relied upon as such. The information provided here, whether from a third party or not, is not to be considered as a recommendation; or an offer to buy or sell; or the solicitation of an offer to buy or sell any financial instruments; or to participate in any specific trading strategy. Any research provided does not have regard to the specific investment objectives, financial situation and needs of any specific person who may receive it. We advise any readers of this content to seek their own advice. Without the approval of Vantage, reproduction or redistribution of this information is not permitted.