The crypto space has been closely following US indices, and in particular the Nasdaq. After last week ended bearish for most tokens the upside momentum might be questioned for now. As also US indices show slight negative momentum during the month of September in general a correction in the crypto market could be on the card due to profit- taking. Positive on the other hand might be the potential cut in interest rates by the Fed in the US. This might give the altcoins another push.
Speaking of the altcoin season we can currently observe that the inflows in Bitcoin seems losing some steam and more and more capital is being distributed into the altcoin market. In particular ETH, XRP and SOL might hence get a boost, should the upside gear up momentum again. A break of the recent highs in all markets might hence be a potential entry point.
Technical analysis:
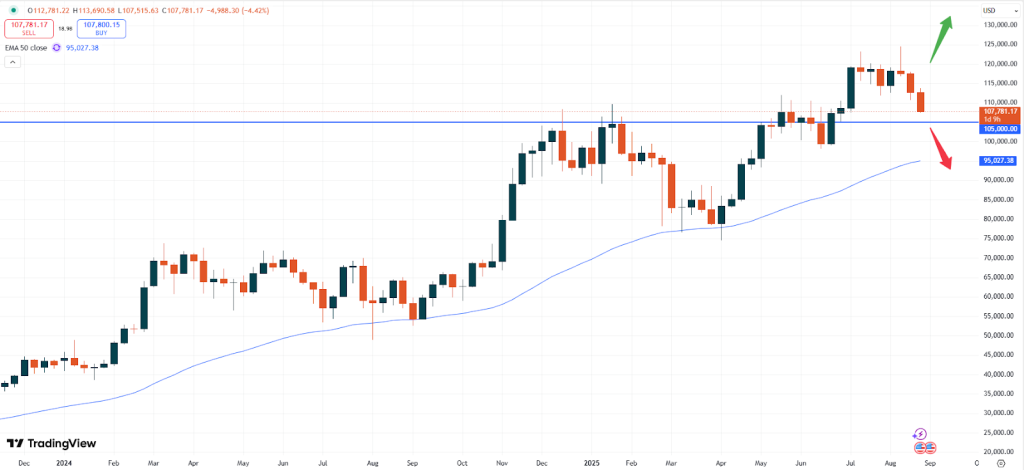
– BTC: Bitcoin is trading at USD 107,781. Last week marked another bearish week in Bitcoin with substantial outflows of the ETF sector in particular. Furthermore, the focus of traders seems to be directed towards the altcoin space, which might offer negative headwinds for now.
BTCUSD, weekly chart
Should the negative trend continue below the USD 107.000 price level, more downside momentum might be observed towards the next support level at USD 105,000. Another slide there might then push the market down towards the 50- moving average, which based on the daily chart currently sits at around the USD 95,000 level.
– ETH: Ethereum is currently trading at USD 4,320. The market has created another All- time- high in August, which in general should be seen as a positive sign. The current correction, however, might also gear up some momentum with the token potentially being ready to fall towards the most recent support at around the USD 3,800 price level.
ETHUSD, monthly chart
At that zone the price will determine whether the upside momentum will still continue to push the market higher again. If the general trend in crypto remains positive, another attempt to break higher should still be factored in. Positive momentum should flow in particular in Ethereum then.
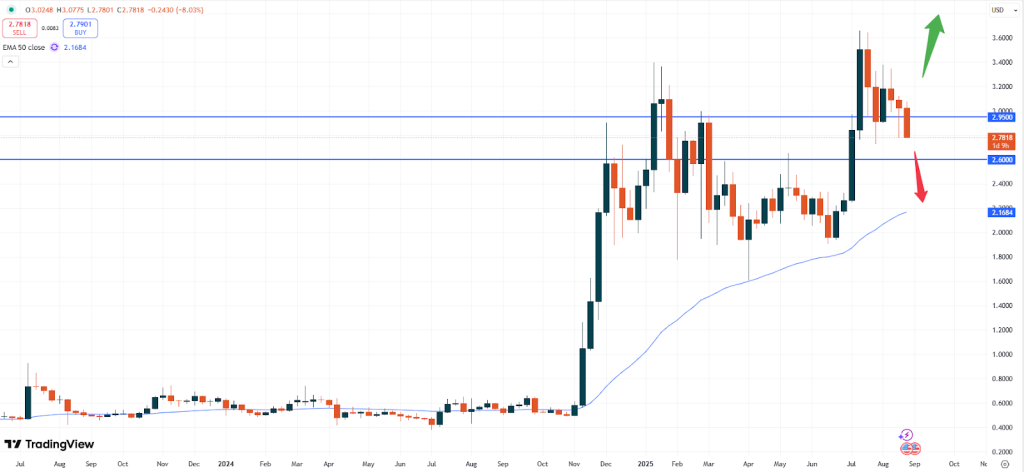
– XRP: XRP is currently trading at USD 2.7818 and thus kept falling out of the strong bullish trend. Positive might still be, that the token has often remained in a sideways zone, before attempting to push higher with strong momentum.
XRPUSD, weekly chart
The current negative sentiment in most tokens might cause the market to fall further. A break of the important support zone at USD 2.6000 could indicate that the price will fall towards the 50- moving average support level near USD 2.1700.
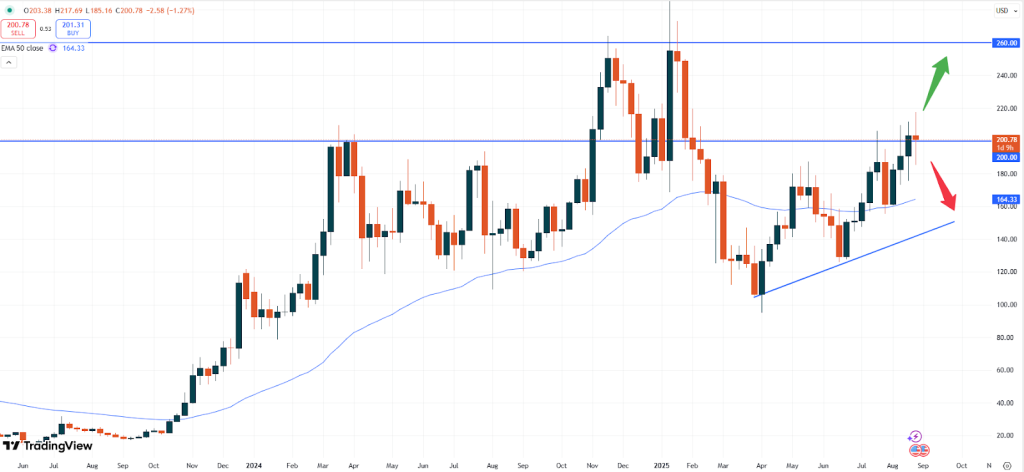
– SOL: Solana is currently trading at USD 200.78. With the market remaining stuck in the sideways pattern, the recent important resistance zone at the current place seems to be in play again.
SOLUSD, weekly chart
The rising trendline and the positive pattern might still suggest, that another attempt of this market to run higher is still intact. Any retracement might hence offer cheaper entries should the market push higher again. A potential target could then be the USD 260.00 price zone. To the downside the market should either be supported with the 50- moving average at USD 165.00 or the rising trendline at about USD 153.00.
Vantage does not represent or warrant that the material provided here is accurate, current, or complete, and therefore should not be relied upon as such. The information provided here, whether from a third party or not, is not to be considered as a recommendation; or an offer to buy or sell; or the solicitation of an offer to buy or sell any financial instruments; or to participate in any specific trading strategy. Any research provided does not have regard to the specific investment objectives, financial situation and needs of any specific person who may receive it. We advise any readers of this content to seek their own advice. Without the approval of Vantage, reproduction or redistribution of this information is not permitted.