Sliding prices following the correction in equities
Vantage Plus Research Team November 10, 2025
Fundamental data:
Stock markets have been falling and also cryptos have not been able to rise again in the past three months. Instead, the negative momentum might continue if current support zones will give way. As we examine below. On the other hand, positive momentum in equities, and in particular the Nasdaq index, might offer fresh upside as well. If stock markets will start to rise again, most tokens might follow moving higher as well.
On another note, Bitcoin has also followed the gold price. With the shining metal currently retracing the outlook remains mixed.
Technical analysis:
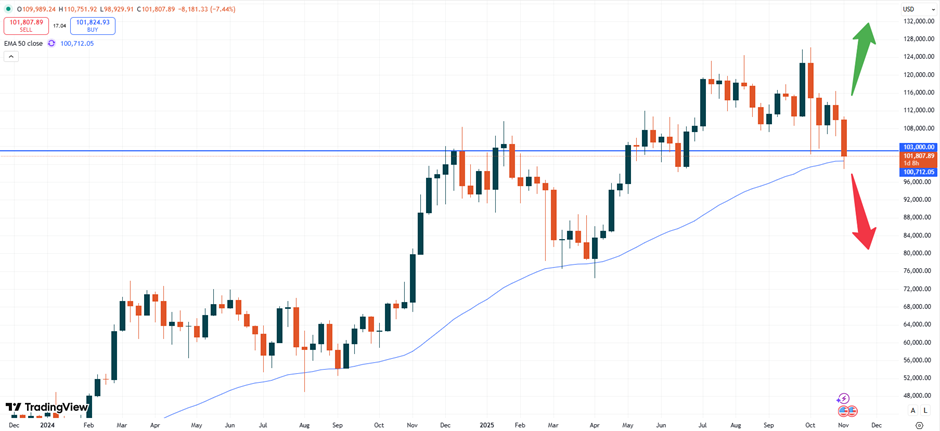
– BTC: Bitcoin is trading at USD 101,777. Based on the weekly chart the token is currently trading on top of an important support level. Having been able to defend the USD 100,000 price level the psychological support might play a vital role. A rise in prices and another attempt above the USD 120,000 level might hence be on the cards. The remaining trading days towards the end of the year could be of support based on the past performance.
BTCUSD, weekly chart
As the chart above shows the positive sentiment might fade below the USD 100,000 price level.
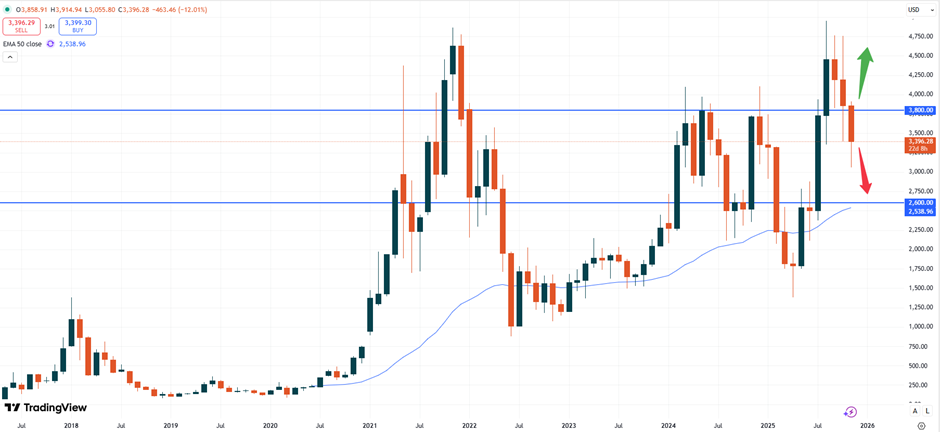
– ETH: Ethereum is currently trading at USD 3,396.28. The monthly chart below shows that the positive sentiment in Ethereum seems to fade. With the break of the USD 3,800 price level the market currently trades in uncertain territory. On the other hand, we are still in the early days of the month and the price might break above that zone again indicating fresh bullish momentum.
ETHUSD, monthly chart
The chart above shows that the next major support zone only comes into play at around the USD 2,600 price level. This is also where the 50- moving average will add extra support.
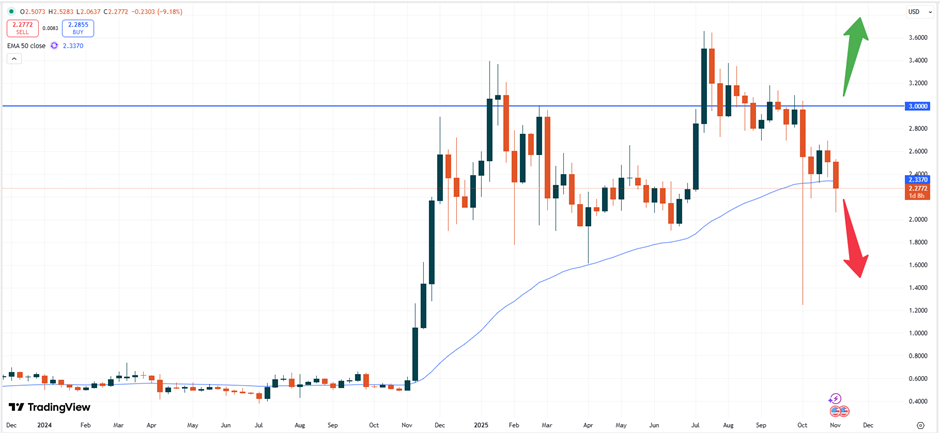
– XRP: Ripple is trading at USD 2.2772. This coin is also falling currently but might offer interesting upside momentum as well. If the market can start trading towards higher levels anytime soon, another attempt to run higher might soon follow.
XRPUSD, weekly chart
It is now important that the token can climb back up above the USD 2.50 price level. At that zone the 50- moving average will also start to act as support again. Furthermore, above the psychological level of USD 3.00 more upside momentum might even follow. This will be the zone above the recent candlestick with the long wick to the downside. A break above might then offer fresh buying activity.
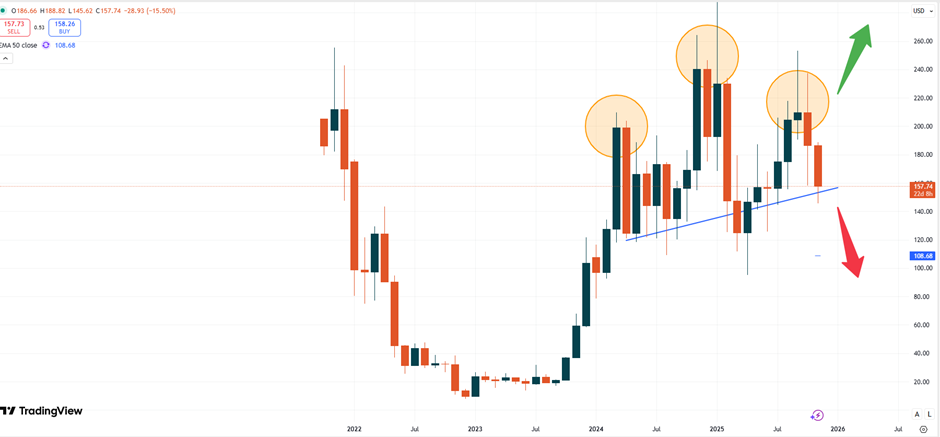
– SOL: Solana is trading at USD 157.64. The candlestick pattern still shows the potential chance that the price of the token will continue to fall back to lower levels. As long as the head and shoulder pattern remain active, traders might face a tough time waiting for upside momentum.
SOLUSD, monthly chart
Currently, the market trades near the slightly rising “neckline” of the head and shoulders pattern. A break of that zone at about USD 150.00 might unleash a further selloff in this market. Vice versa this zone might also act as a support area and could help pushing the price back up. Above the price level at USD 200.00 the bias is expected to become positive.
Vantage does not represent or warrant that the material provided here is accurate, current, or complete, and therefore should not be relied upon as such. The information provided here, whether from a third party or not, is not to be considered as a recommendation; or an offer to buy or sell; or the solicitation of an offer to buy or sell any financial instruments; or to participate in any specific trading strategy. Any research provided does not have regard to the specific investment objectives, financial situation and needs of any specific person who may receive it. We advise any readers of this content to seek their own advice. Without the approval of Vantage, reproduction or redistribution of this information is not permitted.