Crypto markets slipped into extreme fear and the Fear & Greed index has dropped to 10. This is the lowest level since February this year. Bitcoin is trading below psychological price levels and the generally negative sentiment might continue to dominate markets. BTC has been dropping more than 5% in the past seven trading days. The negative trend might derive from profit- taking, outflows of the institutional sector and uncertainty in the macro sector. In particular sliding prices of the Nasdaq 100 index currently harm the crypto market.
Currently, only XRP remains limited in terms of losses and might be the most positive market of all observed here. Should the Fear and greed index show a rebound, fresh buyers might step in leading to another increase in prices.
Technical analysis:
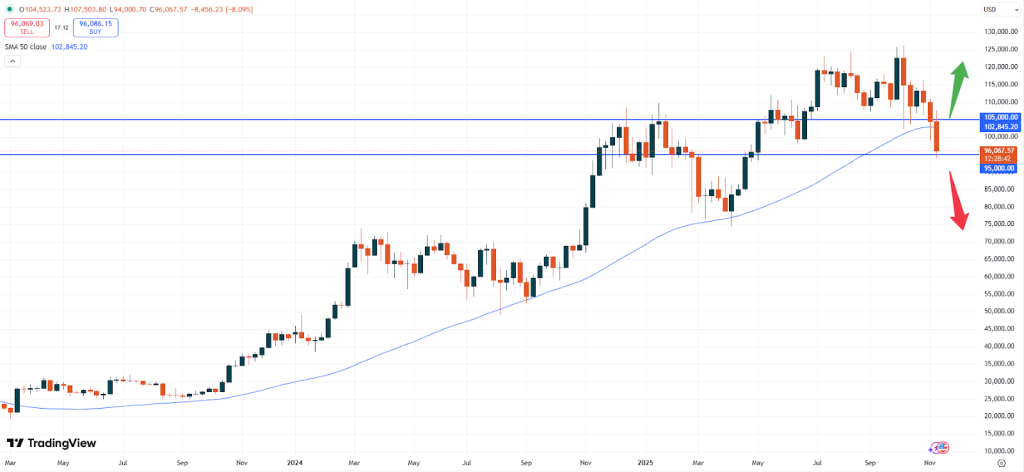
– BTC: Bitcoin is trading at USD 96,070. The market broke below the important psychological resistance zone of USD 100,000. This alone might push away traders and could in the end cause that the momentum will turn bearish after all.
BTCUSD, weekly chart
The weekly chart above shows important trendlines, which might determine the future trend. A break below the USD 95,000 level might cause Bitcoin to weaken further. This could push BTC down towards the USD 70,000 range. Positively, a break above the USD 105,000 level could help pushing prices of Bitcoin back up towards a new all- time- high.
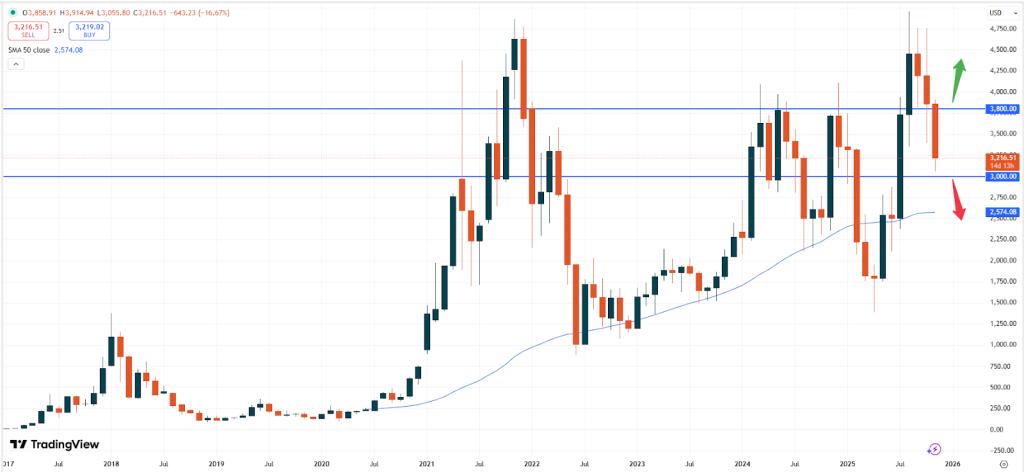
– ETH: Ethereum is trading at USD 3,216. After having created a new all- time- high in August the upside has been limited causing ETH to weaken again. Currently, the market remains range bound in a wide sideways trading zone.
ETHUSD, monthly chart
The monthly chart above shows, that a breakout of that zone is needed in order to determine the trend. While a break below the zone of USD 3,000 might push the market down towards the 50- moving average trendline, a break above the USD 3,800 level might cause Ethereum to strengthen and potentially also create a new all- time- high soon.
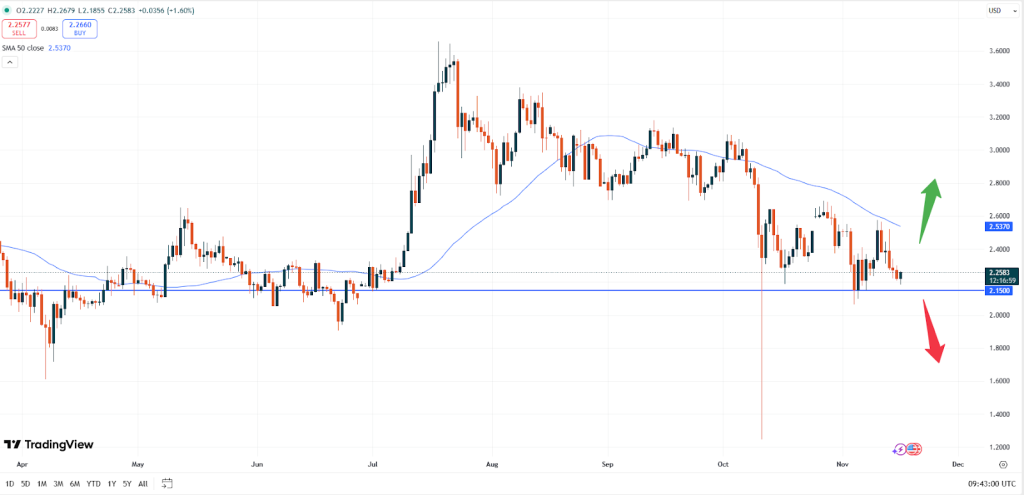
– XRP: Ripple is trading at USD 2.2583. The market has been falling as well, yet seems to remain rater on a positive note currently.
XRPUSD, daily chart
If the negative sentiment continues, XRP might weaken below the technical support zone of USD 2.1500. Falling prices towards the USD 1.8000 area could then be the result. Yet the market has been rather stable and hence the upside of this coin might rather gear up steam as compared to other tokens. Especially a break of the 50- moving average at around USD 2.5000 would help.
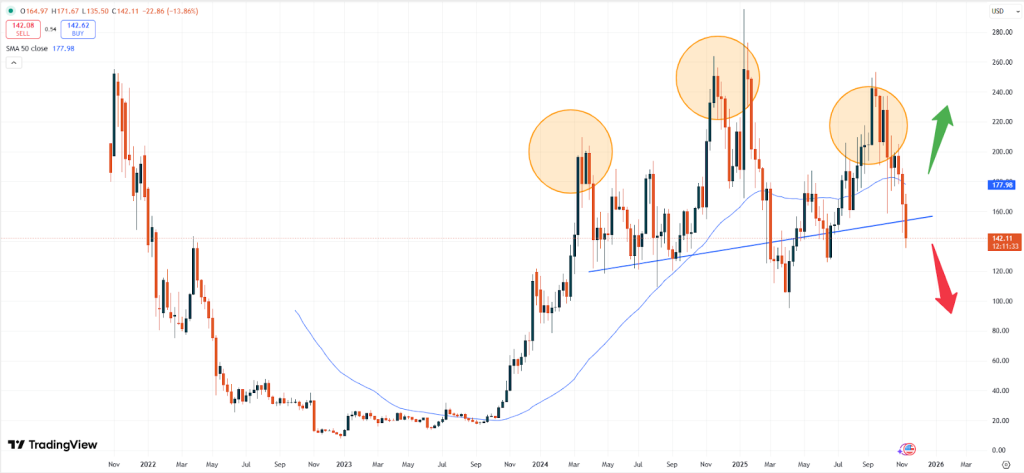
– SOL: Solana is trading at USD 142.05. Based on the technical price pattern the market looks set to weaken further.
SOLUSD, weekly chart
Without any sign of upside momentum, the previously described head- and- shoulders pattern continues to dominate the market. The 50- moving average has been broken and also the slightly rising “neckline” of the chart- pattern broke last week. Downside momentum towards the USD 100.00 area might now follow.
Vantage does not represent or warrant that the material provided here is accurate, current, or complete, and therefore should not be relied upon as such. The information provided here, whether from a third party or not, is not to be considered as a recommendation; or an offer to buy or sell; or the solicitation of an offer to buy or sell any financial instruments; or to participate in any specific trading strategy. Any research provided does not have regard to the specific investment objectives, financial situation and needs of any specific person who may receive it. We advise any readers of this content to seek their own advice. Without the approval of Vantage, reproduction or redistribution of this information is not permitted.