The crypto market did continue to rise slightly during the last week of trading. The positive sentiment might be further supported by the rise of the Nasdaq index in the US. Weakness of the Dollar also helps to push the market to the upside. With the odds increasing that the US Central Bank is expected to cut rates this trend might be due to continue. Furthermore, also the gold price keeps moving higher and hence the crypto markets might indeed follow. Oftentimes both markets had moved in a similar direction when momentum had built up.
Especially with the positive trend in Bitcoin trading back above the USD 90,000 level, more buyers might be attracted into markets.
Worth noting that new Ripple- ETFs have had a positive start as well. With more than USD 644 million added in net inflows the potential rise in the market looks positive.
Technical analysis:
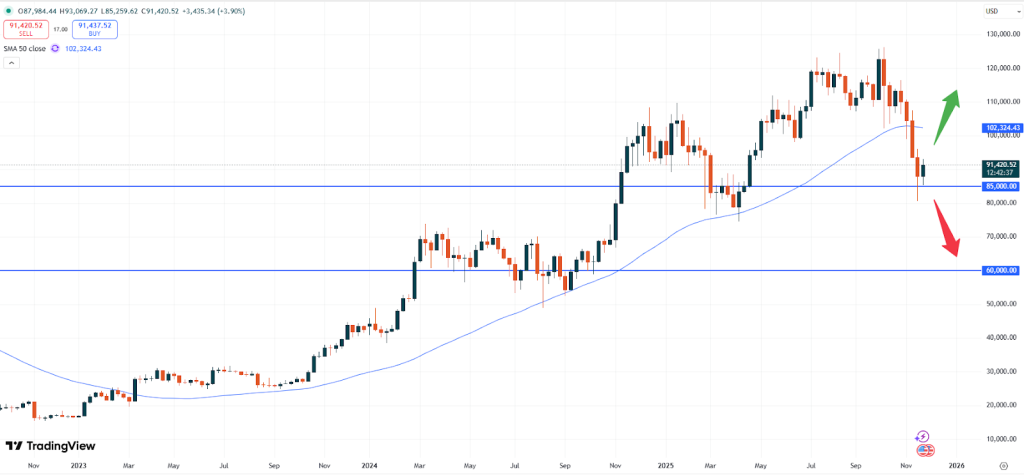
– BTC: Bitcoin is trading at USD 91,440. As Bitcoin was able to defend the critical support level of USD 90,000 more upside momentum might now emerge. The “death” of Bitcoin had potentially been announced too early, as positive fundamental data like Dollar weakness, positive momentum in equities as well as potential rate cuts might further support markets.
BTCUSD, weekly chart
If the price can quickly push higher and even break the 50- moving average at around the USD 102,323 area another attempt towards a new all- time- high might be seen.
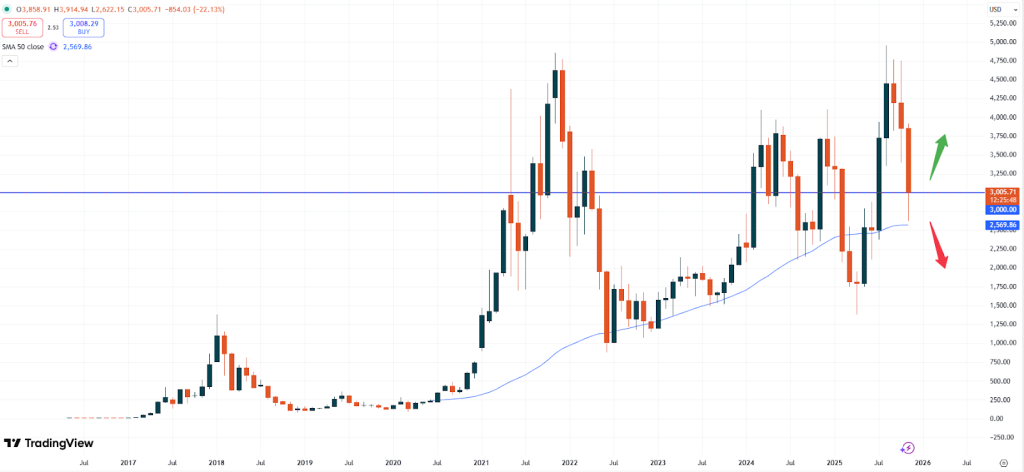
– ETH: Ethereum is currently trading at USD 3,005. The market had moved higher following the recent slide in prices. The price stopped near the 50- moving average level at USD 2,569, indicating a strong support zone. If the positive trend remains in place a push to the upside might be found soon.
ETHUSD, monthly chart
In general, the trend remains positive, as the charting pattern above shows. Yet, a break above the critical resistance level of USD 4,500 is needed in order to confirm more upside momentum. Until then the current sideways- bound trend might continue for now.
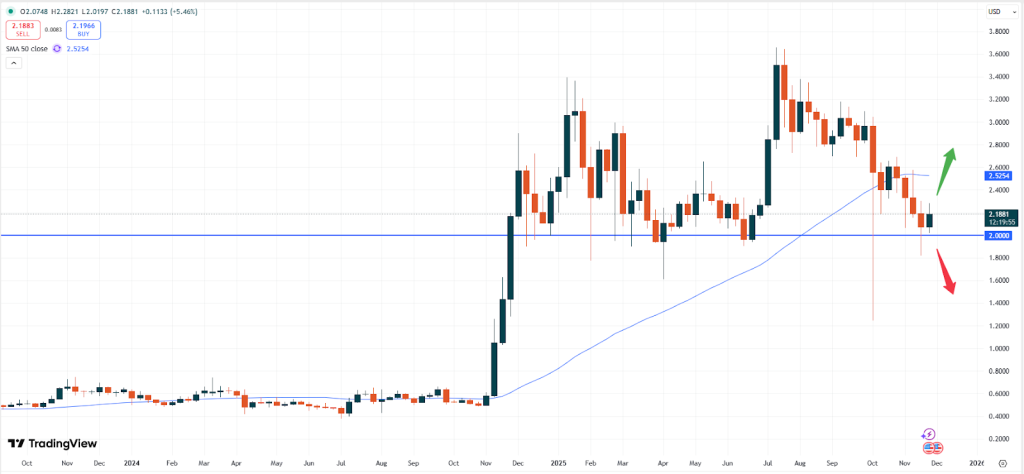
– XRP: XRP is currently trading at USD 2.1875. As previously stated and also mention above the trend in Ripple looks positive as the market did not fall much during the recent retracement to the downside.
XRPUSD, weekly chart
The price is currently trading above the psychological level of USD 2.0000. This might be positive alongside the news of the net- inflows into the new XRP- ETFs. If Ripple can manage to break above the 50- moving average level of USD 2.5300 more upside might emerge.
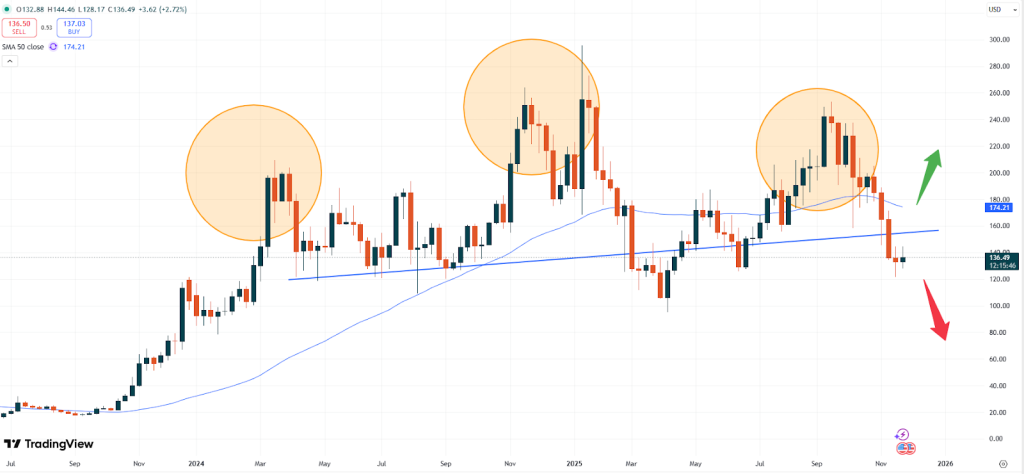
– SOL: Solana is currently trading at USD 136.52. Solana continues to remain under pressure as it has not been able to move to the upside. The price stopped falling but remains under the critical “neckline” in the head – and- shoulders pattern as the chart below shows.
SOLUSD, weekly chart
Should the market continue to move lower, next targets might be found at around the USD 105.00 level as well as the USD 75.00 range. Only a break of the USD 175.00 level, where the 50- moving average acts as a resistance zone might help the price moving higher.
Vantage does not represent or warrant that the material provided here is accurate, current, or complete, and therefore should not be relied upon as such. The information provided here, whether from a third party or not, is not to be considered as a recommendation; or an offer to buy or sell; or the solicitation of an offer to buy or sell any financial instruments; or to participate in any specific trading strategy. Any research provided does not have regard to the specific investment objectives, financial situation and needs of any specific person who may receive it. We advise any readers of this content to seek their own advice. Without the approval of Vantage, reproduction or redistribution of this information is not permitted.