The crypto market remained subdued in recent trading weeks. The price action of the Nasdaq technology index did not offer much clarity. The absence of major news in the crypto market did not offer the long- awaited upside reversal, as the Bulls have seemingly thrown in the towel. However, the first trading week might have offered a glimpse of hope. While the US captured the Venezuelan leader Maduro, markets did not slide further but instead started to run higher. Still, the bets are on the SEC, which is expected to offer friendlier decisions, in particular with the parting of their commissioner Caroline Crenshaw. In particular XRP was hence able to gear up some momentum.
Technical analysis:
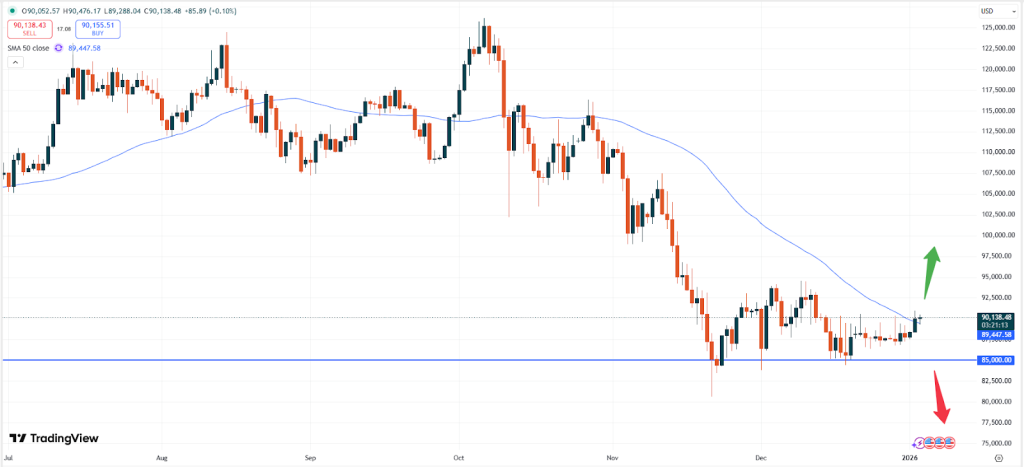
– BTC: Bitcoin is trading at USD 90,148. With the push above the important 50- moving average, more upside momentum might now occur. Furthermore the token also broke above recent levels, and was able to rise above a 3- week high.
BTCUSD, daily chart
The chart above shows, that Bitcoin might now be ready to move higher, with the next target being the USD 94,000 handle.
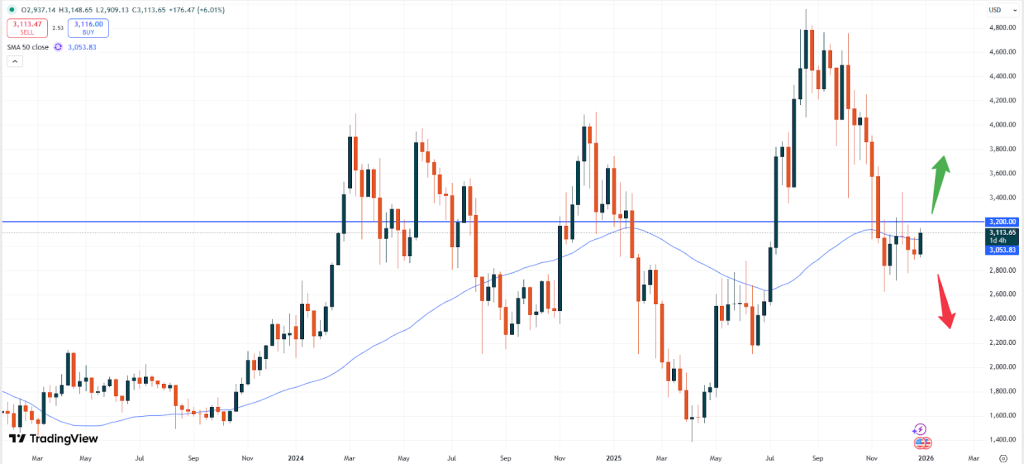
– ETH: Ethereum is currently trading at USD 3,113. The market also broke above the important 50- moving average but keeps trading in a sideways trading zone. A breakout above the important resistance area of USD 3,200 is needed in order to unleash fresh bullish momentum.
ETHUSD, weekly chart
That zone had been important in the past as it can be seen in January 2025 and November 2024. The price might hence quickly proceed higher towards the USD 3,800 level, if the bullish momentum can be ignited again. The general trend might also depend on the overall risk sentiment in markets.
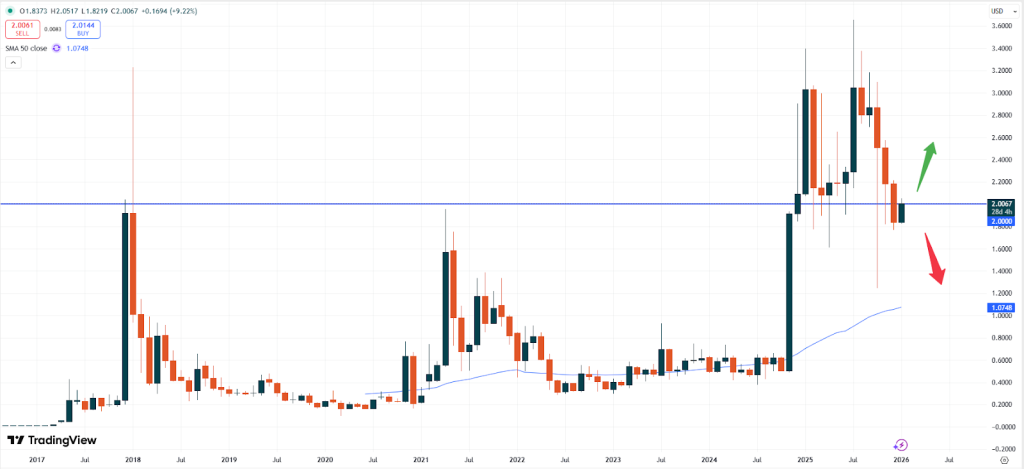
– XRP: XRP is currently trading at USD 2.0060. With the break of the psychological USD 2.000 level, more upside momentum might now be on the cards. On a negative note, the currently bullish momentum during the early days of January might also fade and thus leaving the market more vulnerable for further losses towards the end of the month.
XRPUSD, monthly chart
However, the generally positive trend of the crypto market seems to come back currently and if this trend will last more upside motivation might be seen. The USD 2.0000 zone remains crucial for now and should be in focus.
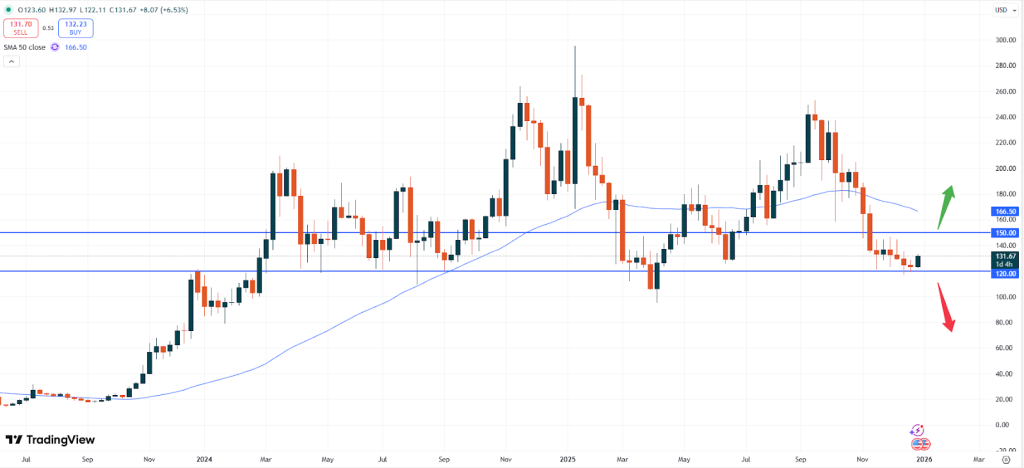
– SOL: Solana is currently trading at USD 131.67. The token remains capped in a sideways trading zone and still does not offer much clarity for now. A breakout out of the zone between USD 120 – 150 is needed in order to determine the new trend.
SOLUSD, weekly chart
The weekly chart above shows, that the price is trading far away of the 50- moving average. Typically, a reading below such area might offer more downside momentum. Yet, the price has been able to defend the import USD 120.00 level. This might also indicate that further gains might follow, if also other tokens are able to gear up steam again.
Vantage does not represent or warrant that the material provided here is accurate, current, or complete, and therefore should not be relied upon as such. The information provided here, whether from a third party or not, is not to be considered as a recommendation; or an offer to buy or sell; or the solicitation of an offer to buy or sell any financial instruments; or to participate in any specific trading strategy. Any research provided does not have regard to the specific investment objectives, financial situation and needs of any specific person who may receive it. We advise any readers of this content to seek their own advice. Without the approval of Vantage, reproduction or redistribution of this information is not permitted.