The crypto market continues to remain positive. Last week, the market went higher initially but was followed by some profit taking, which caused most tokens to end the trading- week in a sideways pattern. The upside momentum remains intact, though. As most crypto currencies were able to break above their recent technical resistance zones the positive sentiment has been re-ignited. Now, markets need another spark to potentially follow up with the positive sentiment, led by Bitcoin.
Technical analysis:
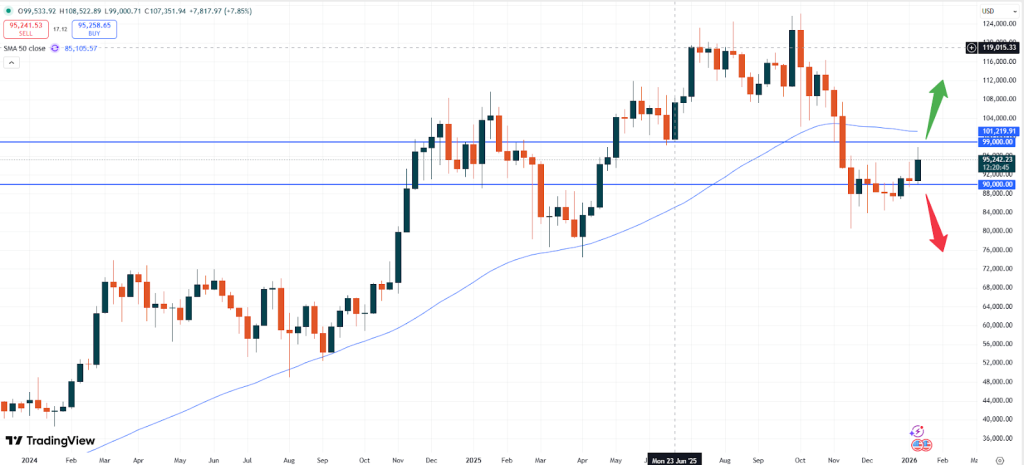
– BTC: Bitcoin is trading at USD 95,242. Since the market has been able to defend the technical and psychological support zone of USD 90,000 more upside momentum might be seen. As the weekly chart below shows, the market is not far away from the 50- moving average area. That zone could be the next target if Bitcoin is able to rise again.
BTCUSD, weekly chart
The weekly chart above shows, that the market has been able to break away from the sideways pattern to the upside. If the USD 100,000 level can be reached quickly, the upside momentum might push Bitcoin back up and eventually also create a new all- time- high soon. The odds remain positive for now.
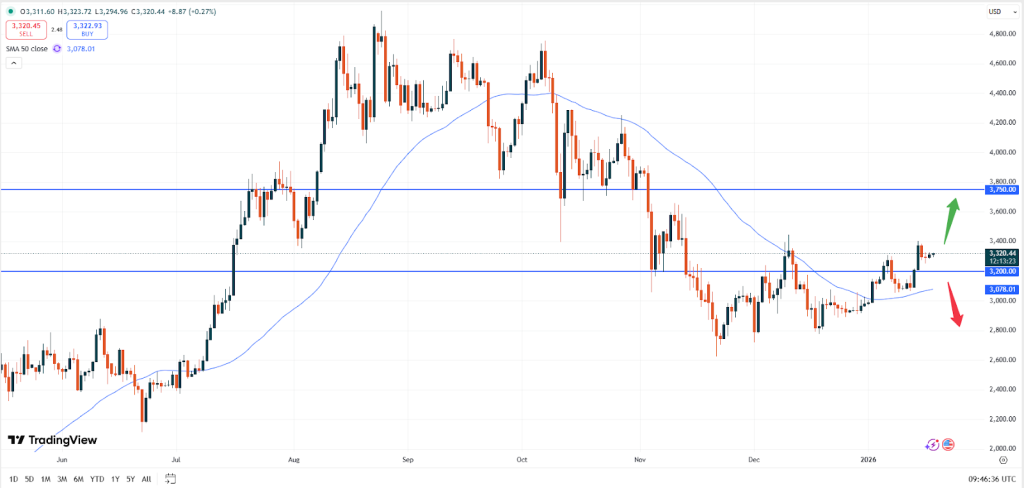
– ETH: Ethereum is trading at USD 3,320. Currently also for ETH the sentiment remains positive. The market has attempted to break higher and seems to remain capped at the technical resistance level of USD 3,400.
ETHUSD, daily chart
As the daily chart above shows, the uptrend remains intact and the slight correction last weekend might end pushing Ethereum back to higher levels. If the market can break higher, the positive momentum might increase towards the USD 3,750 price level.
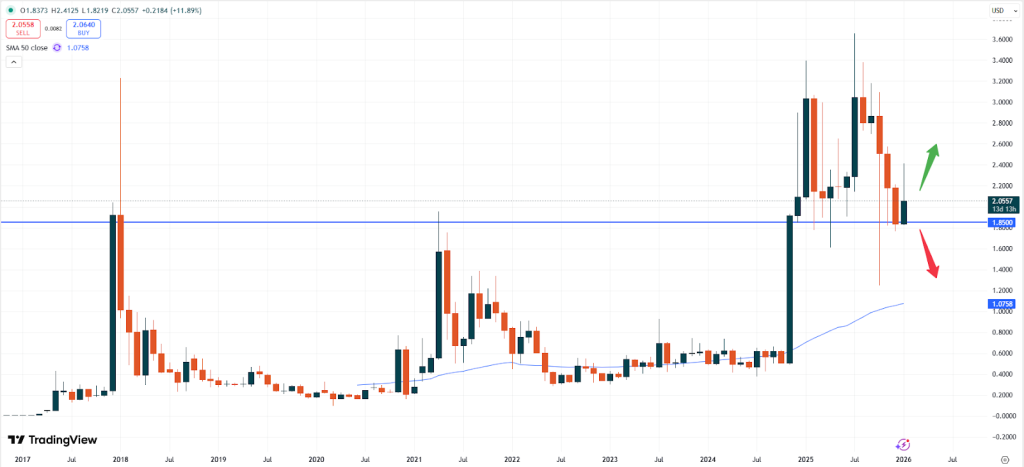
– XRP: Ripple is trading at USD 2.0557. While the positive sentiment can also be seen in XRP the general trend based on the monthly chart has still gotten a big dent. The high so far this month remains at USD 2.4000. Ever since that level has been tested the price had been in a correction to the downside.
XRPUSD, monthly chart
The monthly chart above shows, that the positive momentum keeps fading. Traders should pay attention towards the support level at USD 1.8500. If that zone breaks, more downside momentum might occur. Vice versa a break of the psychological USD 2.5000 price level might indicate positive momentum.
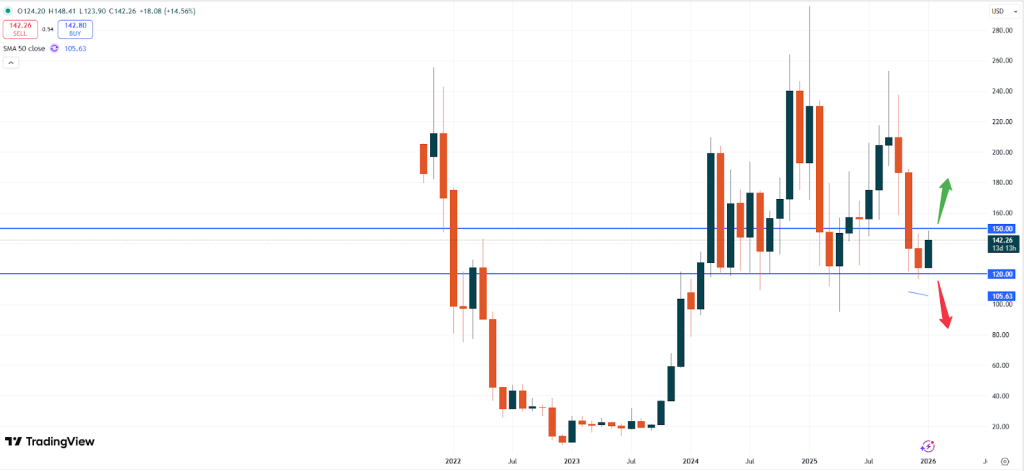
– SOL: Solana is trading at USD 142.26. Comparing this market to XRP, the upside momentum in this market looks positive, again. The price keeps trending higher and seems to be on the way to test the USD 150.00 level.
SOLUSD, monthly chart
Unless the market breaks below the USD 120.00 zone more upside momentum should be expected. The positive sentiment might hence push this token towards the USD 180.00 level.
Vantage does not represent or warrant that the material provided here is accurate, current, or complete, and therefore should not be relied upon as such. The information provided here, whether from a third party or not, is not to be considered as a recommendation; or an offer to buy or sell; or the solicitation of an offer to buy or sell any financial instruments; or to participate in any specific trading strategy. Any research provided does not have regard to the specific investment objectives, financial situation and needs of any specific person who may receive it. We advise any readers of this content to seek their own advice. Without the approval of Vantage, reproduction or redistribution of this information is not permitted.