The crypto market seems to start trading back on positive ground after the positive release of recent US data. On Friday last week, the consumer price index came in slightly below the expectation and as charts reveal this caused the crypto market to rise again. The chance that the US Federal Reserve might start with further rate cuts is hence increasing. The crypto fear & greed index remains in “extreme fear”, which shows underlying downside risks. However, if the market mostly remains bearish this might also suggest a potential recovery in the short run. If everyone remains negative, prices might also develop into the opposite direction.
Technical analysis:
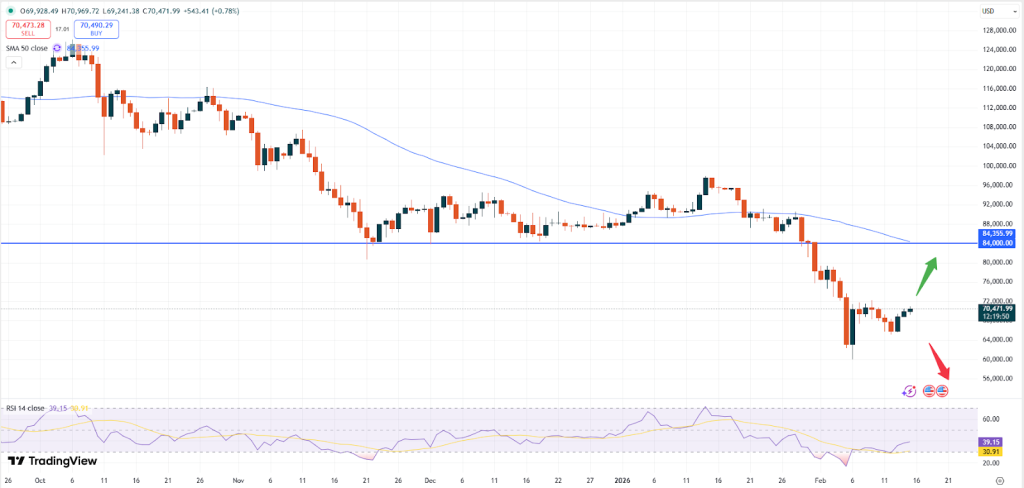
– BTC: Bitcoin is trading at USD 70,472. After the recent slide in the market, which took BTC even below the USD 60,000 level a potential push higher seems to be on the cards for now. Last week showed decline in assets of USD 8.7 billion.
BTCUSD, daily chart
Based on the daily chart above, the market seems to trade higher for now. Early February the market fell into oversold territory based on the RSI indicator. In the short run, this might act positive and a potential rise in Bitcoin towards the USD 84,000 resistance level might be observed.
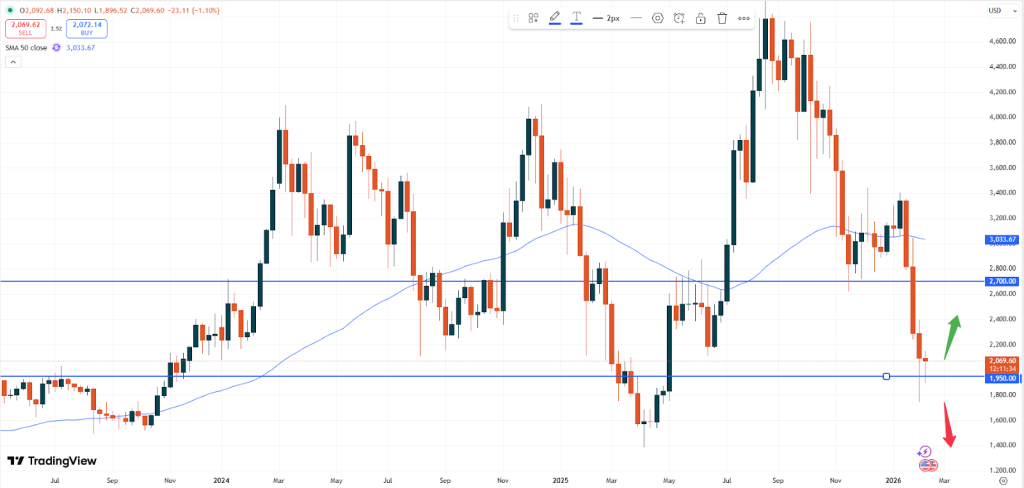
– ETH: Ethereum is trading at USD 2,069. According to US data, net inflows of USD 10.26 million have been recorded on the 13th of February bringing total net inflows by institutional investors back up towards USD 11.65 billion.
ETHUSD, weekly chart
The weekly chart above shows, that the price keeps rising on top of an important support zone. The area of USD 1,950 used to be a resistance area, back in July 2023 and might now help the market to rise again. If the positive trend persists the upside might continue towards the USD 2,700 price level.
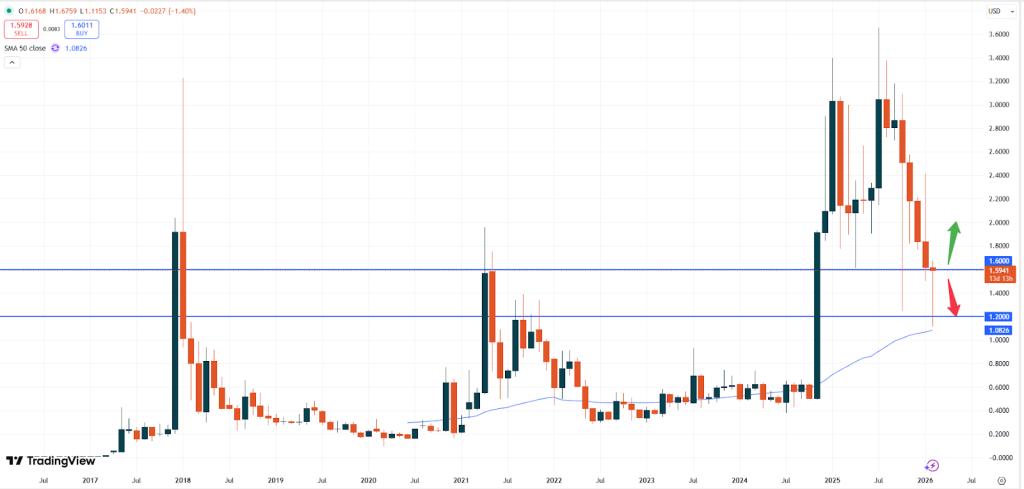
– XRP: Ripple is trading at USD 1.5924. The positive retracement in Ripple looks appealing based on technical observations. Also, it seems that investors keep holding onto this asset, as reserves on exchanges have been falling recently. This oftentimes means, that an accumulation phase will be on the way, which could result in rising prices.
XRPUSD, monthly chart
The monthly chart above shows, that the market stopped to fall at an important support zone. The price areas from May 2021 as well as September 2021 had ben tested and the market bounced back to the upside, again. The monthly candlestick will still need about half of February to be formed but might offer fresh upside momentum ahead. A potential push towards the USD 2.0000 price level could hence be on the cards,
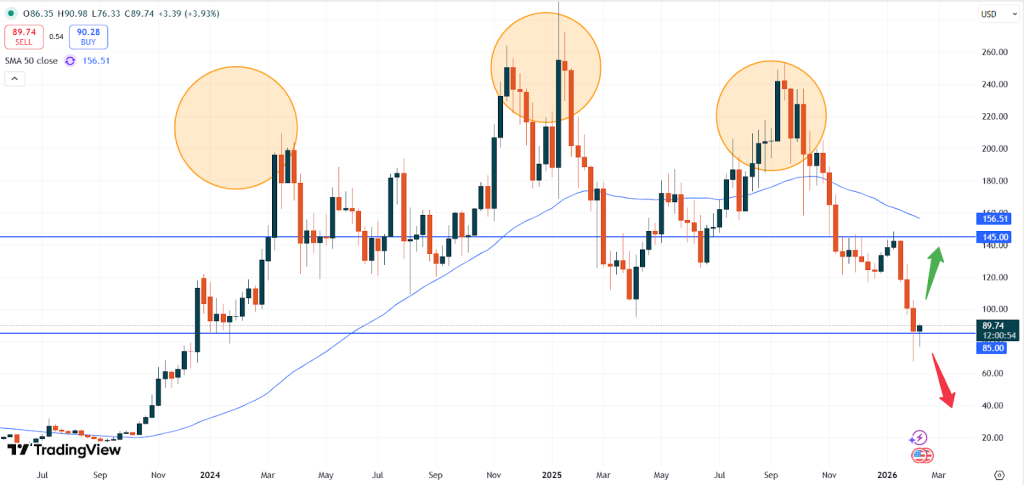
– SOL: Solana is trading at USD 89.74. Also, the price of Solana was finally able to start rebound but prices still lag substantial momentum. Currently, the market also trades on a small support level and if the USD 85.00 price level does not break might hence offer upside momentum.
SOLUSD, weekly chart
However, only a sharp increase in prices above the level of USD 145.00 would offer fresh positive sentiment. Below that level the risk is likely still tilted to the downside as the bearish head- and- shoulders pattern continue to be in control of market direction.
Vantage does not represent or warrant that the material provided here is accurate, current, or complete, and therefore should not be relied upon as such. The information provided here, whether from a third party or not, is not to be considered as a recommendation; or an offer to buy or sell; or the solicitation of an offer to buy or sell any financial instruments; or to participate in any specific trading strategy. Any research provided does not have regard to the specific investment objectives, financial situation and needs of any specific person who may receive it. We advise any readers of this content to seek their own advice. Without the approval of Vantage, reproduction or redistribution of this information is not permitted.