The crypto market shows some signs of positive momentum. Following the recent rise in positive risk sentiment most tokens started to push higher again. Yet with no outcome during the peace talks between the United States and Iran the sentiment might now suffer. The positivity remains mostly visible in Bitcoin, while only some bigger altcoins currently follow.
The weakness of the Dollar might also support positive flows. Last week’s consumer price index from the US came in slightly weaker than expected but still rose 0.9%. The core rate grew only 0.2%, which was seemingly a reason why BTC then resumed fresh upside momentum.
The quantum computing topic continues to impact markets. Yet with the slight rise in prices also positive headlines can be found. According to researchers most coins will be safe as potential new solutions are being developed. No sudden crash should hence be expected in the near future. Furthermore, it would generally take a long time for such attacks to take full effect.
Technical analysis:
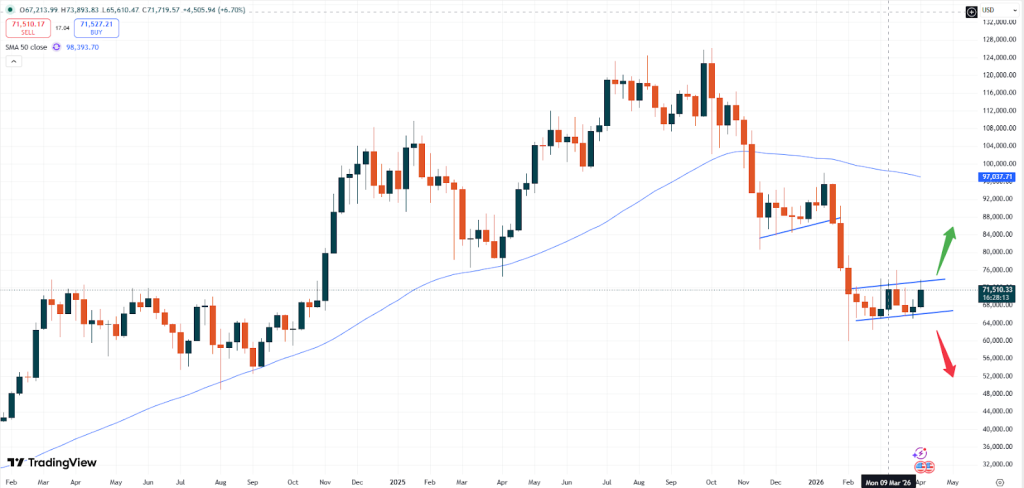
– BTC: Bitcoin is trading at USD 71,510. Following the break away from the recent support level, the price of Bitcoin was able to rise. Currently, the market is testing the technical resistance zone. A break above the USD 75,000 level might then unleash fresh upside momentum. With potential positive news in regards to geopolitical tensions the market might rise further.
BTCUSD, weekly chart
Should a break above the level occur, BTC might move towards the USD 80,000 level. At that range the next technical resistance level can be found. A break below the current support level would cause the market to fall further.
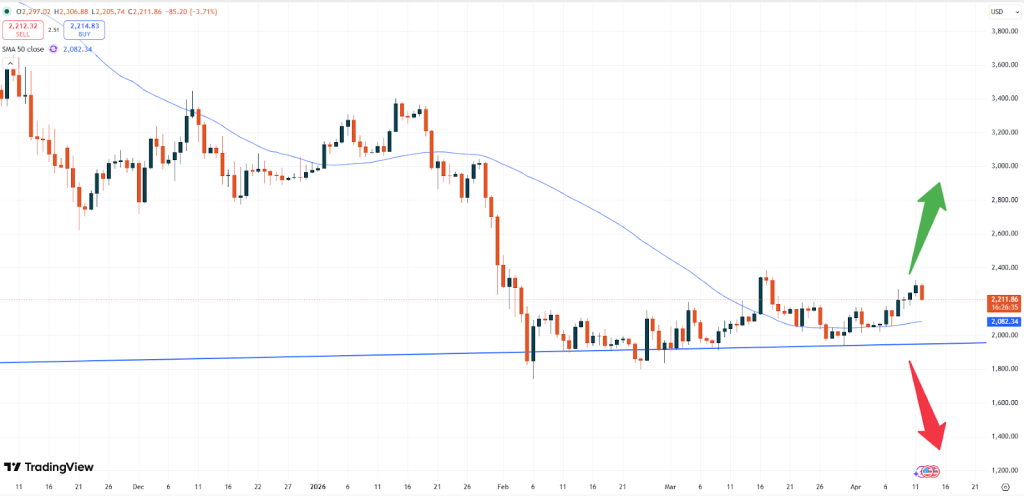
– ETH: Ethereum is currently trading at USD 2,212. Similarly to Bitcoin also Ether is able to rise further. The positive momentum can be seen mostly in these two tokens.
ETHUSD, daily chart
Ethereum is also trading above the 50- moving average zone, which might cause the market to get a further lift to higher levels. Especially a break above the level of USD 2,350 might offer more upside, as that level is the upcoming technical resistance level. If that zone can’t be broken the market might resume the downside again, as seen before towards the end of January this year.
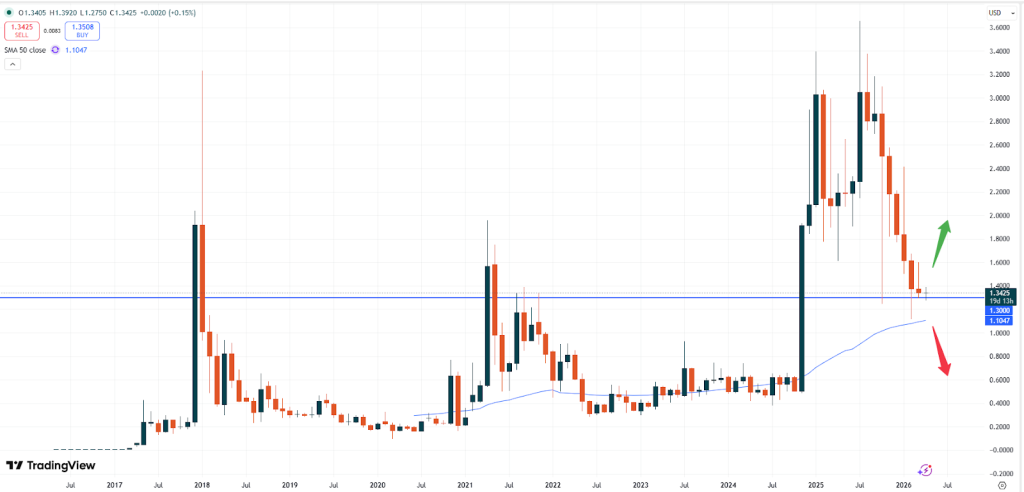
– XRP: Ripple is trading at USD 1.3425. The price looks still set to weaken further based on the monthly chart below.
XRPUSD, monthly chart
The recent bearish candlestick from March shows that prices will rather fall, as the market was not able to start pushing higher last month. Also, last week’s positive price action of BTC and ETH can’t be seen in XRP. Especially a break below the support level of USD 1.3000 will now act as a trigger. If that level breaks a slide towards the next support at USD 1.1000 might follow.
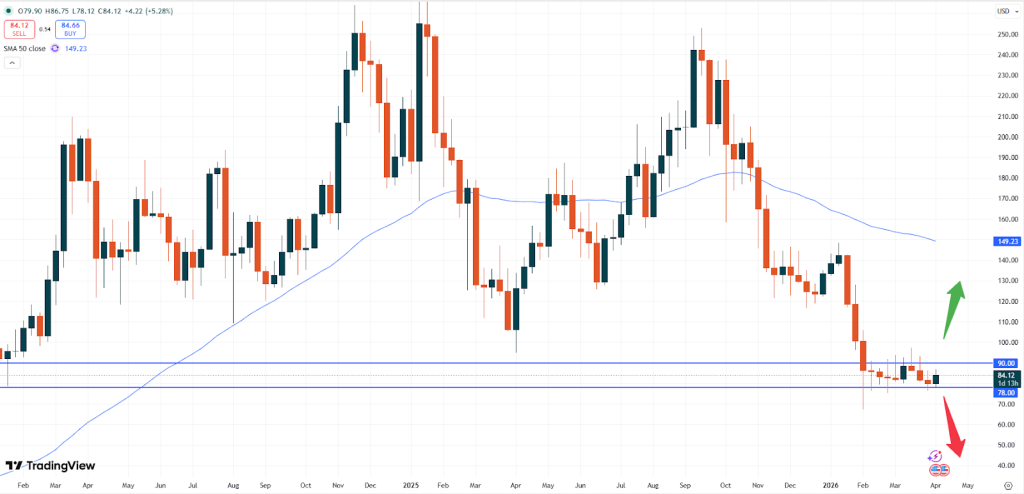
– SOL: Solana is trading at USD 84.12. Last week’s slight positive trend helps this market but the token continues lagging behind. A break of the important resistance level of USD 90.00 is needed in order to push this market higher.
SOLUSD, weekly chart
If the market is not able to push beyond that zone the sideways pattern might continue and eventually push Solana lower again. Especially the break of the USD 78.00 level might then increase the selling pressure again.
Vantage does not represent or warrant that the material provided here is accurate, current, or complete, and therefore should not be relied upon as such. The information provided here, whether from a third party or not, is not to be considered as a recommendation; or an offer to buy or sell; or the solicitation of an offer to buy or sell any financial instruments; or to participate in any specific trading strategy. Any research provided does not have regard to the specific investment objectives, financial situation and needs of any specific person who may receive it. We advise any readers of this content to seek their own advice. Without the approval of Vantage, reproduction or redistribution of this information is not permitted.