The crypto market remains driven by the price of Bitcoin. The positive sentiment of the token also helped the altcoin market with most tokens able to rise alongside. However, days with prices moved lower had been amplified. While Bitcoin remained in a sideways trend, XRP, ADA and SOL had even broken their recent support zones potentially escalating losses.
In general, the new escalation between the United States and Iran remains in focus. The price of BTC and ETH did not move much as Teheran declared the Strait of Hormuz closed again. While oil prices should be expected to rise again the Federal Reserve should be expected to remain hawkish with their approach to interest rates. This, in turn, might strengthen the dollar and hence push risky assets like stocks and cryptos to the downside.
Technical analysis:
– BTC: Bitcoin is trading at USD 63,775. The trend of this market remains somewhat positive. Now it is important that BTC will clear the USD 66,000 price level in order to generate more upside. That zone was an important support zone in February this year and might hence now act as technical resistance. If the level can be cleared the market might push back higher towards the USD 80,000 range.
,
BTCUSD, weekly chart
To the downside the market currently looks well supported. The price should not move below the USD 60,000 handle in order to remain bullish. Bitcoin still remains the driving force in the crypto market.
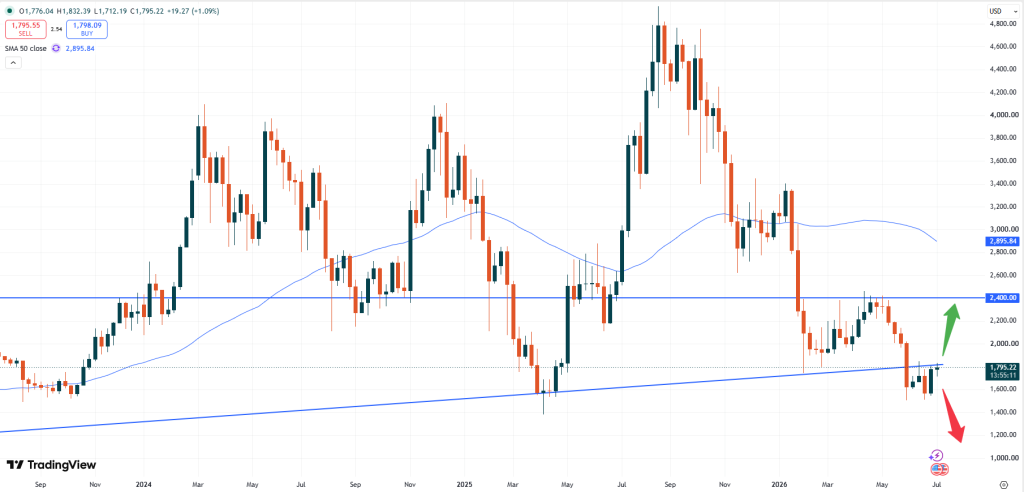
– ETH: Ethereum is currently trading at USD 1,795. The positive momentum and the break away to the upside from the recent technical support level continues to look promising. With the USD 1,800 level in reach the market might regain positive momentum.
ETHUSD, weekly chart
As per the weekly chart above, the market also remains on track to push back up inside the uptrend- range. A potential target could then be the USD 2,400 handle, where the next resistance zone kicks in.
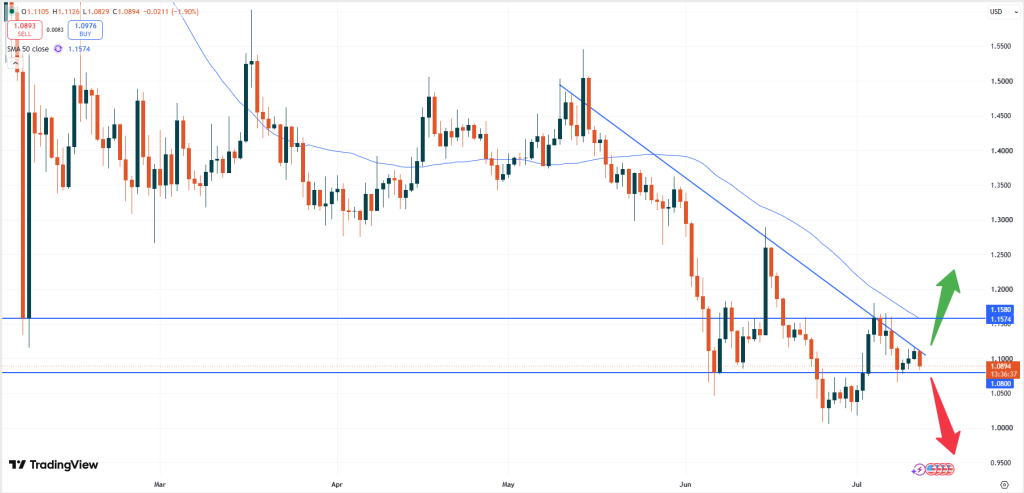
– XRP: Ripple is trading at USD 1.0894. The market remains in its positive uptrend but also needs to break the important resistance zone in order to move higher. A break of the falling trendline to the upside might then unleash positive momentum. Above 1.1100 XRP might then start to move back towards the USD 1.1580 resistance zone, which had been important in February this year.
XRPUSD, daily chart
If Ripple fails to break higher the price might continue to push lower as well. Below USD 1.1000 sellers might continue to remain in charge and hence push prices down. The bearish pressure might increase under the USD 1.0800 level. A move towards parity should then be kept in mind.
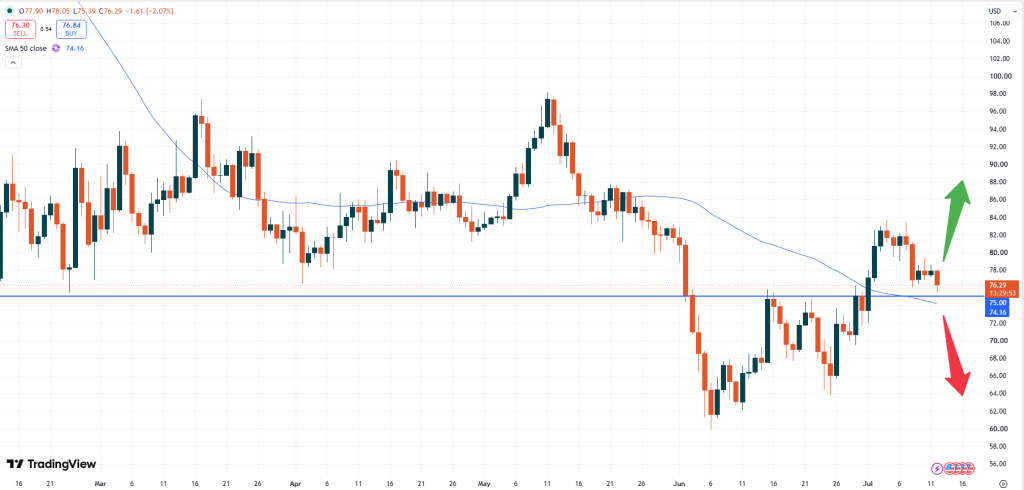
– SOL: Solana is trading at USD 76.29. The market remains on a slight support zone but with the break lower on Wednesday last week sellers seem to be in control for now.
SOLUSD, daily chart
Now the focus comes to the USD 75.00 level. If that zone can be defended, the price might start to push higher again. A break of that level to the downside, on the other hand, might unleash fresh selling pressure. Further moves of most tokens might depend on the general risk sentiment. If the war against Iran escalates more pressure due to the fading risk sentiment and a potentially stronger dollar might be on the cards.
Vantage does not represent or warrant that the material provided here is accurate, current, or complete, and therefore should not be relied upon as such. The information provided here, whether from a third party or not, is not to be considered as a recommendation; or an offer to buy or sell; or the solicitation of an offer to buy or sell any financial instruments; or to participate in any specific trading strategy. Any research provided does not have regard to the specific investment objectives, financial situation and needs of any specific person who may receive it. We advise any readers of this content to seek their own advice. Without the approval of Vantage, reproduction or redistribution of this information is not permitted.


 About Us
 Premium Client
 Premium Perks
 Promotions
 Premium Trading


 Vantage Plus Research Team