SHARE
this page
FacebookTwitterLinkedInWhatsAppTelegramMessenger

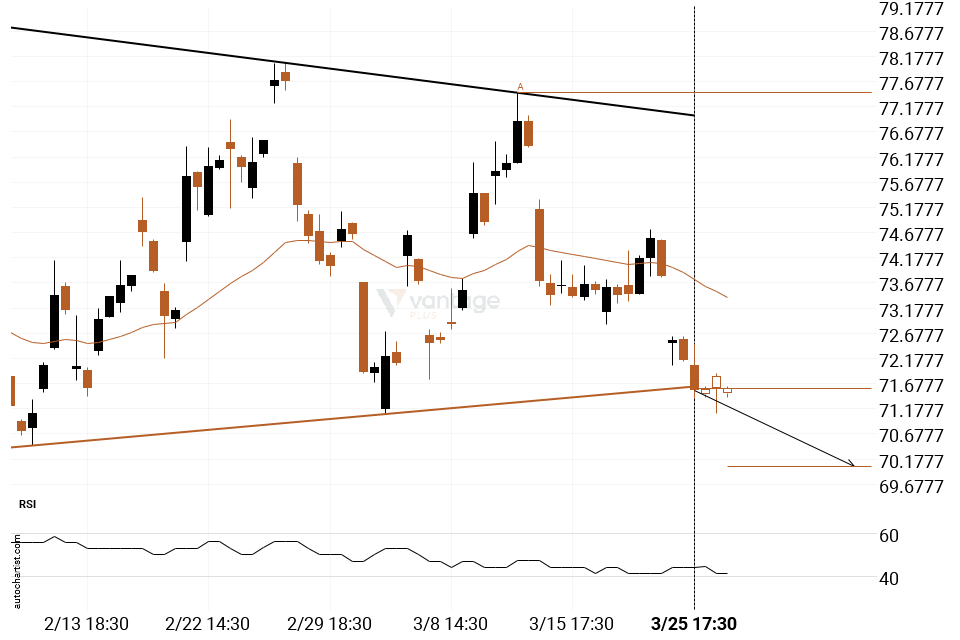
bearish technical pattern on Alibaba 4 hour


Alibaba moved through the support line of a Triangle at 71.581875 on the 4 hour chart. This line has been tested a number of times in the past and this breakout could mean an upcoming change from the current trend. It may continue in its current direction toward 70.0369.

Trading Experience Plus

Previous
Next

Fast & easy account opening

  • Register

    Choose an account type and submit your application

  • Fund

    Fund your account using a wide range of funding methods

  • Trade

    Access 500+ instruments across all asset classes on MT4/MT5

That's it, it's that easy to open a Forex and CFD trading account.
Welcome to the world of trading!
Open Live Account

Contact Us

  • General Enquiries

    We are here to provide you with a successful trading journey from account opening to funding and trading.

    [email protected]
  • Premium Clients

    If you are interested in becoming a premium to unlock your extra services as a high-volume trader or joining Vantage Club, please email us below.

    [email protected]

JOIN COMMUNITY

telegram